Symantec 2010 Annual Report Download - page 115
Download and view the complete annual report
Please find page 115 of the 2010 Symantec annual report below. You can navigate through the pages in the report by either clicking on the pages listed below, or by using the keyword search tool below to find specific information within the annual report.-
 1
1 -
2
-
3
-
4
-
5
-
6
-
7
-
8
-
9
-
10
-
11
-
12
-
13
-
14
-
15
-
16
-
17
-
18
-
19
-
20
-
21
-
22
-
23
-
24
-
25
-
26
-
27
-
28
-
29
-
30
-
31
-
32
-
33
-
34
-
35
-
36
-
37
-
38
-
39
-
40
-
41
-
42
-
43
-
44
-
45
-
46
-
47
-
48
-
49
-
50
-
51
-
52
-
53
-
54
-
55
-
56
-
57
-
58
-
59
-
60
-
61
-
62
-
63
-
64
-
65
-
66
-
67
-
68
-
69
-
70
-
71
-
72
-
73
-
74
-
75
-
76
-
77
-
78
-
79
-
80
-
81
-
82
-
83
-
84
-
85
-
86
-
87
-
88
-
89
-
90
-
91
-
92
-
93
-
94
-
95
-
96
-
97
-
98
-
99
-
100
-
101
-
102
-
103
-
104
-
 105
105 -
 106
106 -
 107
107 -
 108
108 -
 109
109 -
 110
110 -
 111
111 -
 112
112 -
 113
113 -
 114
114 -
 115
115 -
 116
116 -
 117
117 -
 118
118 -
 119
119 -
 120
120 -
 121
121 -
 122
122 -
 123
123 -
 124
124 -
 125
125 -
126
-
127
-
128
-
129
-
130
-
131
-
132
-
133
-
134
-
135
-
136
-
137
-
138
-
139
-
140
-
141
-
142
-
143
-
144
-
145
-
146
-
147
-
148
-
149
-
150
-
151
-
152
-
153
-
154
-
155
-
156
-
157
-
158
-
159
-
160
-
161
-
162
-
163
-
164
-
165
-
166
-
167
-
168
-
169
-
170
-
171
-
172
-
173
-
174
-
175
-
176
-
177
-
178
-
179
-
180
-
181
-
182
-
183
-
184
 |
 |

Other segment
Fiscal
2010 $ %
Fiscal
2009 $ %
Fiscal
2008
2010 vs. 2009 2009 vs. 2008
($ in millions)
Other segment . . ................. $ — $ (1) (100)% $ 1 $ (1) (50)% $ 2
Percentage of total net revenue....... 0% 0% 0%
Other operating loss ............... $(1,437) $7,535 * $(8,972) $(7,519) * $(1,453)
Percentage of Other revenue......... * * *
* Percentage not meaningful
Revenue from our Other segment consists primarily of sunset products and products nearing the end of their
life cycle. The operating loss of our Other segment includes general and administrative expenses; amortization of
acquired product rights, other intangible assets, and other assets; impairment charges for goodwill and assets held
for sale; charges such as stock-based compensation and restructuring; and certain indirect costs that are not charged
to the other operating segments. The operating loss of our Other segment for fiscal 2009 primarily consisted of a
non-cash goodwill impairment charge of $7.4 billion.
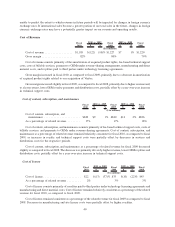
Net revenue by geographic region
Fiscal
2010 $ %
Fiscal
2009 $ %
Fiscal
2008
2010 vs. 2009 2009 vs. 2008
($ in millions)
Americas (U.S., Canada and Latin America) . . ..... $3,241 $ (75) (2)% $3,316 $220 7% $3,096
Percentage of total net revenue . ................ 54% 54% 53%
EMEA (Europe, Middle East, Africa) . ........... $1,838 $(120) (6)% $1,958 $ (5) 0% $1,963
Percentage of total net revenue . ................ 31% 32% 33%
Asia Pacific/Japan .......................... $ 906 $ 30 3% $ 876 $ 61 7% $ 815
Percentage of total net revenue . ................ 15% 14% 14%
Total net revenue ........................... $5,985 $6,150 $5,874
Americas revenue decreased for fiscal 2010 as compared to fiscal 2009 primarily due to decreased revenue
related to our Storage and Server Management, Security and Compliance and Services segments, partially offset by
increased revenue related to our Consumer segment.
EMEA revenue decreased for fiscal 2010 as compared to fiscal 2009 primarily due to decreased revenue across
all of our segments, particularly Storage and Server Management.
Asia Pacific Japan revenue increased for fiscal 2010 as compared to fiscal 2009 primarily due to increased
revenue related to our Consumer and Security and Compliance segments, partially offset by decreased revenue in
our Storage and Server Management segment.
Americas revenue increased for fiscal 2009 as compared to fiscal 2008 primarily due to increased revenue
related to our Storage and Server Management and Services segments. In addition, for fiscal 2009 as compared to
fiscal 2008, Americas revenue related to our Consumer segment increased driven by demand for our Consumer
segment products suites.
EMEA revenue decreased slightly for fiscal 2009 as compared to fiscal 2008 primarily due to decreased
revenue related to our Consumer and Security and Compliance segments as a result of a strengthening U.S. dollar
and a decrease in endpoint security product sales to small and medium sized businesses. This decrease was partially
offset by an increase in revenue related to our Storage and Server Management and Services segments.
Asia Pacific Japan revenue increased for fiscal 2009 as compared to fiscal 2008 primarily due to increased
revenue related to our Storage and Server Management segment.
Our international sales are and will continue to be a significant portion of our net revenue. As a result, net
revenue will continue to be affected by foreign currency exchange rates as compared to the U.S. dollar. We are
39