Sysco 2009 Annual Report Download - page 28
Download and view the complete annual report
Please find page 28 of the 2009 Sysco annual report below. You can navigate through the pages in the report by either clicking on the pages listed below, or by using the keyword search tool below to find specific information within the annual report.-
 1
1 -
2
-
3
-
4
-
5
-
6
-
7
-
8
-
9
-
10
-
11
-
12
-
13
-
14
-
15
-
16
-
17
-
 18
18 -
 19
19 -
 20
20 -
 21
21 -
 22
22 -
 23
23 -
 24
24 -
 25
25 -
 26
26 -
 27
27 -
 28
28 -
 29
29 -
 30
30 -
 31
31 -
 32
32 -
 33
33 -
 34
34 -
 35
35 -
 36
36 -
 37
37 -
 38
38 -
39
-
40
-
41
-
42
-
43
-
44
-
45
-
46
-
47
-
48
-
49
-
50
-
51
-
52
-
53
-
54
-
55
-
56
-
57
-
58
-
59
-
60
-
61
-
62
-
63
-
64
-
65
-
66
-
67
-
68
-
69
-
70
-
71
-
72
-
73
-
74
-
75
-
76
-
77
-
78
-
79
-
80
-
81
-
82
-
83
-
84
-
85
-
86
-
87
-
88
-
89
-
90
-
91
-
92
 |
 |

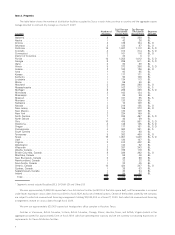
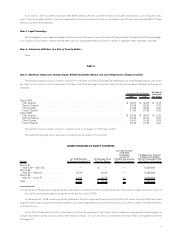
Item 2. Properties
The table below shows the number of distribution facilities occupied by Sysco in each state, province or country and the aggregate square
footage devoted to cold and dry storage as of June 27, 2009.
Location
Number of
Facilities
Cold Storage
(Thousands
Square Feet)
Dry Storage
(Thousands
Square Feet)
Segment
Served*
Alabama . ................................................. 2 184 228 BL
Alaska ................................................... 1 43 26 BL
Arizona .................................................. 2 125 104 BL,O
Arkansas ................................................. 2 132 87 BL,O
California ................................................. 18 1,037 1,113 BL, S, O
Colorado ................................................. 4 313 214 BL,S,O
Connecticut ............................................... 3 161 116 BL,O
District of Columbia . . ........................................ 1 22 3 O
Florida ................................................... 16 1,252 1,012 BL, S, O
Georgia .................................................. 6 289 511 BL,S,O
Idaho . ................................................... 2 84 88 BL
Illinois ................................................... 5 373 356 BL,S,O
Indiana . .................................................. 2 100 126 BL,O
Iowa . ................................................... 1 93 95 BL
Kansas . .................................................. 1 177 171 BL
Kentucky ................................................. 1 92 106 BL
Louisiana ................................................. 1 134 113 BL
Maine ................................................... 1 59 50 BL
Maryland ................................................. 3 290 288 BL,O
Massachusetts ............................................. 2 162 213 BL,S
Michigan ................................................. 5 265 389 BL,S,O
Minnesota ................................................ 2 163 134 BL
Mississippi . ............................................... 1 95 69 BL
Missouri . ................................................. 2 107 95 BL,S
Montana ................................................. 1 120 109 BL
Nebraska ................................................. 1 74 108 BL
Nevada .................................................. 3 219 125 BL,O
New Jersey ............................................... 3 159 373 BL,O
New Mexico . .............................................. 1 120 108 BL
NewYork................................................. 2 224 199 BL
North Carolina . ............................................. 7 326 497 BL,S,O
North Dakota .............................................. 1 46 59 BL
Ohio . ................................................... 10 478 561 BL,S,O
Oklahoma. ................................................ 4 145 125 BL,S,O
Oregon .................................................. 3 177 161 BL,S,O
Pennsylvania. .............................................. 4 363 361 BL,S
South Carolina ............................................. 1 151 98 BL
Tennessee ................................................ 5 383 460 BL,O
Texas . ................................................... 19 1,057 1,048 BL, S, O
Utah . ................................................... 1 120 107 BL
Virginia. .................................................. 3 510 402 BL
Washington ............................................... 1 134 92 BL
Wisconsin ................................................ 2 287 243 BL
Alberta, Canada. ............................................ 2 195 176 BL
British Columbia, Canada ...................................... 8 229 292 BL,O
Manitoba, Canada . . . ........................................ 1 58 46 BL
New Brunswick, Canada ...................................... 2 48 56 BL
Newfoundland, Canada ....................................... 1 33 22 BL
Nova Scotia, Canada . ........................................ 1 33 45 BL
Ontario, Canada ............................................ 10 434 347 BL,O
Quebec, Canada ............................................ 1 36 63 BL
Saskatchewan, Canada ....................................... 1 40 54 BL
Ireland ................................................... 3 84 67 BL
Total . .................................................. 186 12,035 12,111
* Segments served include Broadline (BL), SYGMA (S) and Other (O).
We own approximately 19,558,000 square feet of our distribution facilities (or 81.0% of the total square feet), and the remainder is occupied
under leases expiring at various dates from fiscal 2010 to fiscal 2029, exclusive of renewal options. Certain of the facilities owned by the company
are subject to industrial revenue bond financing arrangements totaling $13,903,000 as of June 27, 2009. Such industrial revenue bond financing
arrangements mature at various dates through fiscal 2029.
We own our approximately 625,000 square foot headquarters office complex in Houston, Texas.
Facilities in Vancouver, British Columbia; Victoria, British Columbia; Chicago, Illinois; Houston, Texas; and Suffolk, Virginia (which in the
aggregate accounted for approximately 5.4% of fiscal 2009 sales) are operating near capacity and we are currently constructing expansions or
replacements for these distribution facilities.
8