Sysco 2009 Annual Report Download - page 64
Download and view the complete annual report
Please find page 64 of the 2009 Sysco annual report below. You can navigate through the pages in the report by either clicking on the pages listed below, or by using the keyword search tool below to find specific information within the annual report.-
 1
1 -
2
-
3
-
4
-
5
-
6
-
7
-
8
-
9
-
10
-
11
-
12
-
13
-
14
-
15
-
16
-
17
-
18
-
19
-
20
-
21
-
22
-
23
-
24
-
25
-
26
-
27
-
28
-
29
-
30
-
31
-
32
-
33
-
34
-
35
-
36
-
37
-
38
-
39
-
40
-
41
-
42
-
43
-
44
-
45
-
46
-
47
-
48
-
49
-
50
-
51
-
52
-
53
-
 54
54 -
 55
55 -
 56
56 -
 57
57 -
 58
58 -
 59
59 -
 60
60 -
 61
61 -
 62
62 -
 63
63 -
 64
64 -
 65
65 -
 66
66 -
 67
67 -
 68
68 -
 69
69 -
 70
70 -
 71
71 -
 72
72 -
 73
73 -
 74
74 -
75
-
76
-
77
-
78
-
79
-
80
-
81
-
82
-
83
-
84
-
85
-
86
-
87
-
88
-
89
-
90
-
91
-
92
 |
 |

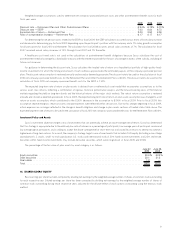
FSP FAS 107-1 and APB 28-1
In April 2009, the FASB issued FASB Staff Position No. FAS 107-1 and APB 28-1, “Interim Disclosures about Fair Value of Financial Instruments”
(FSP FAS 107-1 and APB 28-1). FSP FAS 107-1 and APB 28-1 amend FASB Statement No. 107, “Disclosures about Fair Value of Financial
Instruments,” and APB Opinion No. 28, “Interim Financial Reporting,” to require disclosures about the fair value of financial instruments for interim
reporting periods of publicly traded companies. Prior disclosure requirements only applied to annual financial statements. This standard is effective
for interim reporting periods ending after June 15, 2009, which is the first quarter of fiscal 2010 for Sysco. The company will provide the disclosures
about the fair value of financial instruments required by FSP FAS 107-1 and APB 28-1 in its interim financial statement disclosures beginning in fiscal
2010.
4. FAIR VALUE MEASUREMENTS
Cash equivalents primarily include time deposits, certificates of deposit, short-term investments and all highly liquid instruments with original
maturities of three months or less. The fair values of cash equivalents reflected in the consolidated balance sheets were $839,554,000 and
$341,958,000 as of June 27, 2009 and June 28, 2008, respectively. Pursuant to SFAS 157, the fair value of the company’s cash equivalents is
determined based on “Level 1” inputs, which consist of quoted prices in active markets for identical assets. As of these dates, the company held no
other assets or liabilities requiring fair value measurement or disclosure.
The fair value of Sysco’s total long-term debt is estimated based on the quoted market prices for the same or similar issues or on the current
rates offered to the company for debt of the same remaining maturities. The fair value of total long-term debt approximated $2,548,861,000 as of
June 27, 2009 and $1,928,595,000 as of June 28, 2008, respectively. See further discussion of the carrying value of Sysco’s total-long-term debt at
Note 11, Debt.
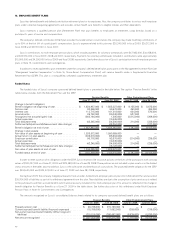
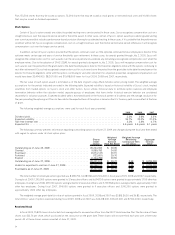
5. ALLOWANCE FOR DOUBTFUL ACCOUNTS
A summary of the activity in the allowance for doubtful accounts appears below:
2009 2008 2007
Balance at beginning of period . . ................................. $ 31,730,000 $ 31,841,000 $ 29,100,000
Charged to costs and expenses . ................................. 74,638,000 32,184,000 28,156,000
Allowance accounts resulting from acquisitions and other ................ 1,587,000 72,000 595,000
Customer accounts written off, net of recoveries ...................... (71,877,000) (32,367,000) (26,010,000)
Balance at end of period ....................................... $ 36,078,000 $ 31,730,000 $ 31,841,000
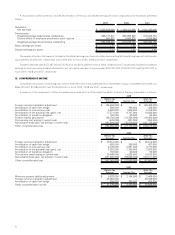
6. PLANT AND EQUIPMENT
A summary of plant and equipment, including the related accumulated depreciation, appears below:
June 27, 2009 June 28, 2008
Estimated Useful
Lives
Plant and equipment, at cost:
Land ................................................. $ 307,328,000 $ 270,157,000
Buildings and improvements . ................................ 2,818,300,000 2,652,091,000 10-30 years
Fleet and equipment ...................................... 2,072,116,000 2,029,964,000 3-10 years
Computer hardware and software. . . ............................ 569,669,000 512,271,000 3-6 years
5,767,413,000 5,464,483,000
Accumulated depreciation .................................... (2,788,213,000) (2,574,693,000)
Net plant and equipment ..................................... $ 2,979,200,000 $ 2,889,790,000
Depreciation expense, including capital leases, for the past three years was $361,062,000 in 2009, $352,569,000 in 2008 and $341,714,000
in 2007.
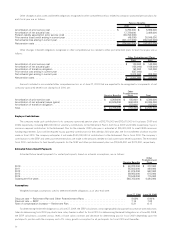
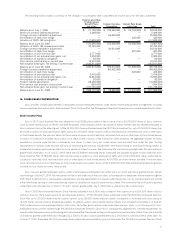
7. GOODWILL AND OTHER INTANGIBLES
The changes in the carrying amount of goodwill and the amount allocated by reportable segment for the years presented are as follows:
Broadline SYGMA Other Total
Carrying amount as of June 30, 2007 .................... $ 740,305,000 $ 32,609,000 $ 582,399,000 $ 1,355,313,000
Goodwill acquired during year ......................... 11,537,000 — 33,861,000 45,398,000
Currency translation/Other . . . ......................... 12,518,000 — (5,000) 12,513,000
Carrying amount as of June 28, 2008 .................... 764,360,000 32,609,000 616,255,000 1,413,224,000
Goodwill acquired during year ......................... 109,406,000 — 22,107,000 131,513,000
Currency translation/Other . . . ......................... (33,954,000) — 12,000 (33,942,000)
Carrying amount as of June 27, 2009 .................... $ 839,812,000 $ 32,609,000 $ 638,374,000 $ 1,510,795,000
Amortized intangible assets acquired during fiscal 2009 were $46,380,000 with a weighted-average amortization period of seven years. By
intangible asset category, the amortized intangible assets acquired during fiscal 2009 were: customer relationships of $44,331,000 with a
weighted-average amortization period of seven years, non-compete agreements of $958,000 with a weighted-average amortization period of seven
44