Sysco 2009 Annual Report Download - page 81
Download and view the complete annual report
Please find page 81 of the 2009 Sysco annual report below. You can navigate through the pages in the report by either clicking on the pages listed below, or by using the keyword search tool below to find specific information within the annual report.-
 1
1 -
2
-
3
-
4
-
5
-
6
-
7
-
8
-
9
-
10
-
11
-
12
-
13
-
14
-
15
-
16
-
17
-
18
-
19
-
20
-
21
-
22
-
23
-
24
-
25
-
26
-
27
-
28
-
29
-
30
-
31
-
32
-
33
-
34
-
35
-
36
-
37
-
38
-
39
-
40
-
41
-
42
-
43
-
44
-
45
-
46
-
47
-
48
-
49
-
50
-
51
-
52
-
53
-
54
-
55
-
56
-
57
-
58
-
59
-
60
-
61
-
62
-
63
-
64
-
65
-
66
-
67
-
68
-
69
-
70
-
 71
71 -
 72
72 -
 73
73 -
 74
74 -
 75
75 -
 76
76 -
 77
77 -
 78
78 -
 79
79 -
 80
80 -
 81
81 -
 82
82 -
 83
83 -
 84
84 -
 85
85 -
 86
86 -
 87
87 -
 88
88 -
 89
89 -
 90
90 -
 91
91 -
92
 |
 |

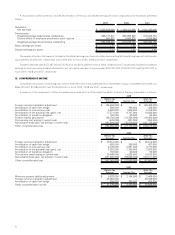
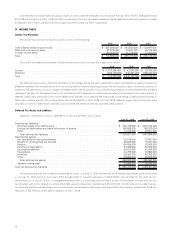
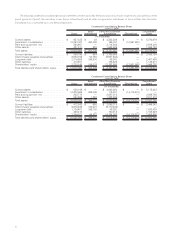
The sales mix for the principal product categories for each fiscal year is as follows:
2009 2008 2007
(In thousands)
Canned and dry products ......................................... $ 7,091,420 $ 6,820,363 $ 6,161,946
Fresh and frozen meats .......................................... 6,394,447 6,606,347 6,548,127
Frozen fruits, vegetables, bakery and other . . . .......................... 5,122,415 5,105,353 4,691,114
Dairy products . ................................................ 3,750,684 4,000,780 3,245,488
Poultry ...................................................... 3,709,553 3,808,844 3,585,462
Fresh produce . ................................................ 3,017,018 3,183,540 3,118,122
Paper and disposables ........................................... 2,911,029 2,964,006 2,825,505
Seafood ..................................................... 1,740,292 1,878,830 1,840,149
Beverage products . ............................................. 1,322,300 1,297,543 1,200,263
Janitorial products .............................................. 940,097 988,781 857,339
Equipment and smallwares . . . ..................................... 661,309 704,050 763,179
Medical supplies ............................................... 192,766 163,674 205,381
Total . ....................................................... $ 36,853,330 $ 37,522,111 $ 35,042,075
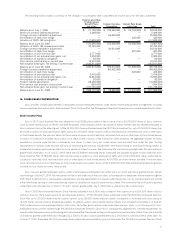
Information concerning geographic areas is as follows:
2009 2008 2007
Fiscal Year
(In thousands)
Sales:
(1)
United States . ............................................... $ 33,378,485 $ 33,842,824 $ 31,891,186
Canada . . . ................................................. 3,134,989 3,380,159 2,923,106
Other ..................................................... 339,856 299,128 227,783
Total ...................................................... $ 36,853,330 $ 37,522,111 $ 35,042,075
Long-lived assets:
(2)
United States . ............................................... $ 2,725,200 $ 2,655,714 $ 2,531,980
Canada . . . ................................................. 223,320 233,879 189,154
Other ..................................................... 30,680 197 99
Total ...................................................... $ 2,979,200 $ 2,889,790 $ 2,721,233
(1)
Represents sales to external customers from businesses operating in these countries.
(2)
Long-lived assets represents net property, plant and equipment reported in the country in which they are held.
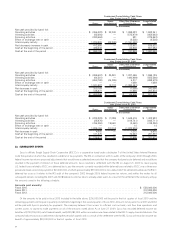
21. SUPPLEMENTAL GUARANTOR INFORMATION
Sysco International, Co. is an unlimited liability company organized under the laws of the Province of Nova Scotia, Canada and is a wholly-
owned subsidiary of Sysco. In May 2002, Sysco International, Co. issued, in a private offering, $200,000,000 of 6.10% notes due in 2012 (see
Note 11, Debt). In December 2002, these notes were exchanged for substantially identical notes in an exchange offer registered under the Securities
Act of 1933.These notes are fully and unconditionally guaranteed by Sysco. Sysco International, Co. is a holding company with no significant sources
of income or assets, other than its equity interests in its subsidiaries and interest income from loans made to its subsidiaries.The proceeds from the
issuance of the 6.10% notes were used to repay commercial paper issued to fund the fiscal 2002 acquisition of a Canadian broadline foodservice
operation.
61