Sysco 2009 Annual Report Download - page 80
Download and view the complete annual report
Please find page 80 of the 2009 Sysco annual report below. You can navigate through the pages in the report by either clicking on the pages listed below, or by using the keyword search tool below to find specific information within the annual report.-
 1
1 -
2
-
3
-
4
-
5
-
6
-
7
-
8
-
9
-
10
-
11
-
12
-
13
-
14
-
15
-
16
-
17
-
18
-
19
-
20
-
21
-
22
-
23
-
24
-
25
-
26
-
27
-
28
-
29
-
30
-
31
-
32
-
33
-
34
-
35
-
36
-
37
-
38
-
39
-
40
-
41
-
42
-
43
-
44
-
45
-
46
-
47
-
48
-
49
-
50
-
51
-
52
-
53
-
54
-
55
-
56
-
57
-
58
-
59
-
60
-
61
-
62
-
63
-
64
-
65
-
66
-
67
-
68
-
69
-
 70
70 -
 71
71 -
 72
72 -
 73
73 -
 74
74 -
 75
75 -
 76
76 -
 77
77 -
 78
78 -
 79
79 -
 80
80 -
 81
81 -
 82
82 -
 83
83 -
 84
84 -
 85
85 -
 86
86 -
 87
87 -
 88
88 -
 89
89 -
 90
90 -
91
-
92
 |
 |

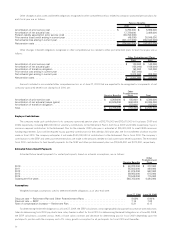
20. BUSINESS SEGMENT INFORMATION
The company has aggregated its operating companies into a number of segments, of which only Broadline and SYGMA are reportable
segments as defined in SFAS No. 131, “Disclosures about Segments of an Enterprise and Related Information.” Broadline operating companies
distribute a full line of food products and a wide variety of non-food products to its customers. SYGMA operating companies distribute a full line of
food products and a wide variety of non-food products to certain chain restaurant customer locations. “Other” financial information is attributable to
the company’s other operating segments, including the company’s specialty produce, custom-cut meat and lodging industry segments and a
company that distributes to international customers.
The accounting policies for the segments are the same as those disclosed by Sysco. Intersegment sales represent specialty produce and meat
company products distributed by the Broadline and SYGMA operating companies. The segment results include certain centrally incurred costs for
shared services that are charged to our segments. These centrally incurred costs are charged based upon the relative level of service used by each
operating company consistent with how Sysco’s management views the performance of its operating segments. Management evaluates the
performance of each of our operating segments based on its respective operating income results, which include the allocation of certain centrally
incurred costs.
Included in corporate expenses and consolidated adjustments, among other items, are:
• Gains and losses recognized to adjust corporate-owned life insurance policies to their cash surrender values;
• Share-based compensation expense related to stock option grants, restricted stock, issuances of stock pursuant to the Employees’ Stock
Purchase Plan and stock grants to non-employee directors; and
• Corporate-level depreciation and amortization expense.
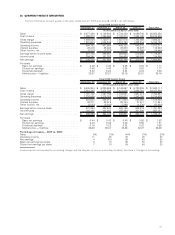
The following table sets forth the financial information for Sysco’s business segments:
2009 2008 2007
Fiscal Year
(In thousands)
Sales:
Broadline . .................................................. $ 29,234,199 $ 29,824,553 $ 27,593,723
SYGMA . ................................................... 4,839,036 4,574,880 4,380,955
Other ..................................................... 3,242,115 3,590,738 3,537,865
Intersegment sales . ........................................... (462,020) (468,060) (470,468)
Total ...................................................... $ 36,853,330 $ 37,522,111 $ 35,042,075
Operating income:
Broadline . .................................................. $ 1,959,963 $ 1,931,881 $ 1,772,493
SYGMA . ................................................... 30,193 8,261 10,842
Other ..................................................... 101,355 136,533 132,508
Total segments. .............................................. 2,091,511 2,076,675 1,915,843
Corporate expenses and consolidated adjustments . ..................... (219,300) (196,726) (207,361)
Total operating income ......................................... 1,872,211 1,879,949 1,708,482
Interest expense. . . ........................................... 116,322 111,541 105,002
Other income, net . ........................................... (14,945) (22,930) (17,735)
Earnings before income taxes .................................... $ 1,770,834 $ 1,791,338 $ 1,621,215
Depreciation and amortization:
Broadline . .................................................. $ 265,526 $ 258,171 $ 249,409
SYGMA . ................................................... 26,753 30,467 29,740
Other ..................................................... 37,629 36,692 30,368
Total segments. .............................................. 329,908 325,330 309,517
Corporate .................................................. 52,431 47,199 53,042
Total ...................................................... $ 382,339 $ 372,529 $ 362,559
Capital expenditures:
Broadline . .................................................. $ 342,550 $ 393,067 $ 405,015
SYGMA . ................................................... 5,053 4,977 41,596
Other ..................................................... 40,857 36,565 55,750
Total segments. .............................................. 388,460 434,609 502,361
Corporate .................................................. 76,101 81,354 100,881
Total ...................................................... $ 464,561 $ 515,963 $ 603,242
Assets:
Broadline . .................................................. $ 5,706,431 $ 5,880,738 $ 5,584,626
SYGMA . ................................................... 366,539 414,044 385,470
Other ..................................................... 914,764 1,005,740 918,025
Total segments. .............................................. 6,987,734 7,300,522 6,888,121
Corporate .................................................. 3,228,885 2,781,771 2,630,810
Total ...................................................... $ 10,216,619 $ 10,082,293 $ 9,518,931
60