Sysco 2009 Annual Report Download - page 31
Download and view the complete annual report
Please find page 31 of the 2009 Sysco annual report below. You can navigate through the pages in the report by either clicking on the pages listed below, or by using the keyword search tool below to find specific information within the annual report.-
 1
1 -
2
-
3
-
4
-
5
-
6
-
7
-
8
-
9
-
10
-
11
-
12
-
13
-
14
-
15
-
16
-
17
-
18
-
19
-
20
-
 21
21 -
 22
22 -
 23
23 -
 24
24 -
 25
25 -
 26
26 -
 27
27 -
 28
28 -
 29
29 -
 30
30 -
 31
31 -
 32
32 -
 33
33 -
 34
34 -
 35
35 -
 36
36 -
 37
37 -
 38
38 -
 39
39 -
 40
40 -
 41
41 -
42
-
43
-
44
-
45
-
46
-
47
-
48
-
49
-
50
-
51
-
52
-
53
-
54
-
55
-
56
-
57
-
58
-
59
-
60
-
61
-
62
-
63
-
64
-
65
-
66
-
67
-
68
-
69
-
70
-
71
-
72
-
73
-
74
-
75
-
76
-
77
-
78
-
79
-
80
-
81
-
82
-
83
-
84
-
85
-
86
-
87
-
88
-
89
-
90
-
91
-
92
 |
 |

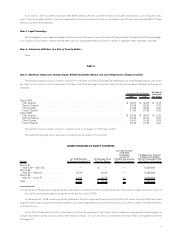
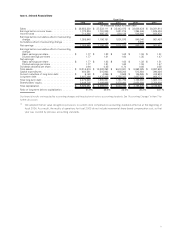
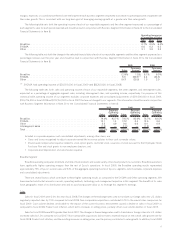
Item 6. Selected Financial Data
2009 2008 2007 2006
(1)
2005
Fiscal Year
(In thousands except for share data)
Sales ............................... $ 36,853,330 $ 37,522,111 $ 35,042,075 $ 32,628,438 $ 30,281,914
Earnings before income taxes .............. 1,770,834 1,791,338 1,621,215 1,394,946 1,525,436
Income taxes . ......................... 714,886 685,187 620,139 548,906 563,979
Earnings before cumulative effect of accounting
change. ............................ 1,055,948 1,106,151 1,001,076 846,040 961,457
Cumulative effect of accounting change ....... — — — 9,285 —
Net earnings .......................... 1,055,948 1,106,151 1,001,076 855,325 961,457
Earnings before cumulative effect of accounting
change:
Basic earnings per share ................ $ 1.77 $ 1.83 $ 1.62 $ 1.36 $ 1.51
Diluted earnings per share ............... 1.77 1.81 1.60 1.35 1.47
Net earnings:
Basic earnings per share ................ $ 1.77 $ 1.83 $ 1.62 $ 1.38 $ 1.51
Diluted earnings per share ............... 1.77 1.81 1.60 1.36 1.47
Dividends declared per share . .............. 0.94 0.85 0.74 0.66 0.58
Total assets . .......................... $ 10,216,619 $ 10,082,293 $ 9,518,931 $ 8,992,025 $ 8,267,902
Capital expenditures ..................... 464,561 515,963 603,242 513,934 390,026
Current maturities of long-term debt . ......... $ 9,163 $ 4,896 $ 3,568 $ 106,265 $ 410,933
Long-term debt . . . ..................... 2,467,486 1,975,435 1,758,227 1,627,127 956,177
Total long-term debt ..................... 2,476,649 1,980,331 1,761,795 1,733,392 1,367,110
Shareholders’ equity . .................... 3,449,702 3,408,986 3,278,400 3,052,284 2,758,839
Total capitalization. . ..................... $ 5,926,351 $ 5,389,317 $ 5,040,195 $ 4,785,676 $ 4,125,949
Ratio of long-term debt to capitalization. ....... 41.8% 36.8% 35.0% 36.2% 33.1%
Our financial results are impacted by accounting changes and the adoption of various accounting standards. See “Accounting Changes” in Item 7 for
further discussion.
(1)
We adopted the fair value recognition provisions in current stock compensation accounting standards effective at the beginning of
fiscal 2006. As a result, the results of operations for fiscal 2005 do not include incremental share-based compensation cost, as that
year was covered by previous accounting standards.
11