Sysco 2009 Annual Report Download - page 85
Download and view the complete annual report
Please find page 85 of the 2009 Sysco annual report below. You can navigate through the pages in the report by either clicking on the pages listed below, or by using the keyword search tool below to find specific information within the annual report.-
 1
1 -
2
-
3
-
4
-
5
-
6
-
7
-
8
-
9
-
10
-
11
-
12
-
13
-
14
-
15
-
16
-
17
-
18
-
19
-
20
-
21
-
22
-
23
-
24
-
25
-
26
-
27
-
28
-
29
-
30
-
31
-
32
-
33
-
34
-
35
-
36
-
37
-
38
-
39
-
40
-
41
-
42
-
43
-
44
-
45
-
46
-
47
-
48
-
49
-
50
-
51
-
52
-
53
-
54
-
55
-
56
-
57
-
58
-
59
-
60
-
61
-
62
-
63
-
64
-
65
-
66
-
67
-
68
-
69
-
70
-
71
-
72
-
73
-
74
-
 75
75 -
 76
76 -
 77
77 -
 78
78 -
 79
79 -
 80
80 -
 81
81 -
 82
82 -
 83
83 -
 84
84 -
 85
85 -
 86
86 -
 87
87 -
 88
88 -
 89
89 -
 90
90 -
 91
91 -
 92
92
 |
 |

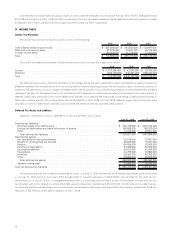
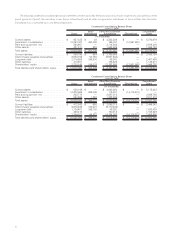
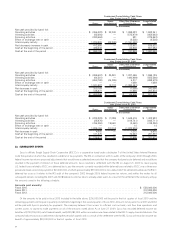
23. QUARTERLY RESULTS (UNAUDITED)
Financial information for each quarter in the years ended June 27, 2009 and June 28, 2008 is set forth below:
September 27 December 27 March 28 June 27 Fiscal Year
Fiscal 2009 Quarter Ended
(In thousands except for share data)
Sales . . ................................. $ 9,877,429 $ 9,149,803 $ 8,739,350 $ 9,086,748 $ 36,853,330
Cost of sales ............................. 7,990,873 7,399,690 7,102,274 7,324,162 29,816,999
Gross margin ............................. 1,886,556 1,750,113 1,637,076 1,762,586 7,036,331
Operating expenses. . . ...................... 1,381,804 1,328,249 1,231,753 1,222,314 5,164,120
Operating income .......................... 504,752 421,864 405,323 540,272 1,872,211
Interest expense . .......................... 26,410 28,400 28,233 33,279 116,322
Other income, net . ......................... (2,813) (5,223) (3,514) (3,395) (14,945)
Earnings before income taxes . ................. 481,155 398,687 380,604 510,388 1,770,834
Income taxes ............................. 204,341 161,033 154,438 195,074 714,886
Net earnings . ............................. $ 276,814 $ 237,654 $ 226,166 $ 315,314 $ 1,055,948
Per share:
Basic net earnings . . ...................... $ 0.46 $ 0.40 $ 0.38 $ 0.53 $ 1.77
Diluted net earnings . ...................... 0.46 0.40 0.38 0.53 1.77
Dividends declared . . ...................... 0.22 0.24 0.24 0.24 0.94
Market price — high/low . ................... 35-27 33-21 25-19 25-21 35-19
September 29 December 29 March 29 June 28 Fiscal Year
Fiscal 2008 Quarter Ended
(In thousands except for share data)
Sales . . ................................. $ 9,405,844 $ 9,239,505 $ 9,146,557 $ 9,730,205 $ 37,522,111
Cost of sales ............................. 7,614,702 7,471,725 7,412,036 7,828,791 30,327,254
Gross margin ............................. 1,791,142 1,767,780 1,734,521 1,901,414 7,194,857
Operating expenses. . . ...................... 1,336,509 1,318,768 1,316,877 1,342,754 5,314,908
Operating income .......................... 454,633 449,012 417,644 558,660 1,879,949
Interest expense . .......................... 26,371 28,915 28,744 27,511 111,541
Other income, net . ......................... (3,032) (8,343) (7,285) (4,270) (22,930)
Earnings before income taxes . ................. 431,294 428,440 396,185 535,419 1,791,338
Income taxes ............................. 164,305 164,292 155,284 201,306 685,187
Net earnings . ............................. $ 266,989 $ 264,148 $ 240,901 $ 334,113 $ 1,106,151
Per share:
Basic net earnings . . ...................... $ 0.44 $ 0.43 $ 0.40 $ 0.56 $ 1.83
Diluted net earnings . ...................... 0.43 0.43 0.40 0.55 1.81
Dividends declared . . ...................... 0.19 0.22 0.22 0.22 0.85
Market price — high/low . ................... 36-30 36-31 32-26 32-27 36-26
Percentage increases— 2009 vs. 2008:
Sales . . ................................. 5% (1)% (4)% (7)% (2)%
Operating income .......................... 11 (6) (3) (3) (0)
Net earnings . ............................. 4 (10) (6) (6) (5)
Basic net earnings per share . .................. 5 (7) (5) (5) (3)
Diluted net earnings per share ................. 7 (7) (5) (4) (2)
Financial results are impacted by accounting changes and the adoption of various accounting standards. See Note 2, Changes in Accounting.
65