Sysco 2009 Annual Report Download - page 72
Download and view the complete annual report
Please find page 72 of the 2009 Sysco annual report below. You can navigate through the pages in the report by either clicking on the pages listed below, or by using the keyword search tool below to find specific information within the annual report.-
 1
1 -
2
-
3
-
4
-
5
-
6
-
7
-
8
-
9
-
10
-
11
-
12
-
13
-
14
-
15
-
16
-
17
-
18
-
19
-
20
-
21
-
22
-
23
-
24
-
25
-
26
-
27
-
28
-
29
-
30
-
31
-
32
-
33
-
34
-
35
-
36
-
37
-
38
-
39
-
40
-
41
-
42
-
43
-
44
-
45
-
46
-
47
-
48
-
49
-
50
-
51
-
52
-
53
-
54
-
55
-
56
-
57
-
58
-
59
-
60
-
61
-
 62
62 -
 63
63 -
 64
64 -
 65
65 -
 66
66 -
 67
67 -
 68
68 -
 69
69 -
 70
70 -
 71
71 -
 72
72 -
 73
73 -
 74
74 -
 75
75 -
 76
76 -
 77
77 -
 78
78 -
 79
79 -
 80
80 -
 81
81 -
 82
82 -
83
-
84
-
85
-
86
-
87
-
88
-
89
-
90
-
91
-
92
 |
 |

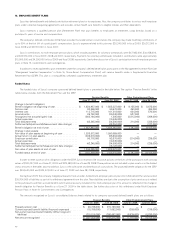
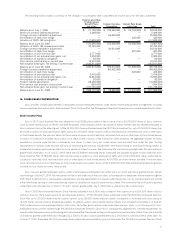
A reconciliation of the numerators and the denominators of the basic and diluted earnings per share computations for the periods presented
follows:
2009 2008 2007
Numerator:
Net earnings . ......................................... $ 1,055,948,000 $ 1,106,151,000 $ 1,001,076,000
Denominator:
Weighted-average basic shares outstanding . ................... 595,127,577 605,905,545 618,332,752
Dilutive effect of employee and director stock options ............. 941,627 5,065,238 8,034,046
Weighted-average diluted shares outstanding ................... 596,069,204 610,970,783 626,366,798
Basic earnings per share: .................................. $ 1.77 $ 1.83 $ 1.62
Diluted earnings per share: . . . .............................. $ 1.77 $ 1.81 $ 1.60
The number of options that were not included in the diluted earnings per share calculation because the effect would have been anti-dilutive was
approximately 63,000,000, 33,400,000 and 21,900,000 for fiscal 2009, 2008 and 2007, respectively.
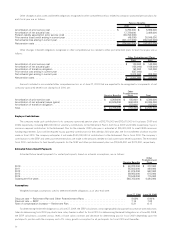
Dividends declared were $557,487,000, $513,593,000 and $456,438,000 in fiscal 2009, 2008 and 2007, respectively. Included in dividends
declared for each year were dividends declared but not yet paid at year-end of approximately $142,000,000, $132,000,000 and $116,000,000 in
fiscal 2009, 2008 and 2007, respectively.
15. COMPREHENSIVE INCOME
Comprehensive income is net earnings plus certain other items that are recorded directly to shareholders’ equity. Comprehensive income was
$846,730,000, $1,018,664,000 and $1,030,025,000 in fiscal 2009, 2008 and 2007, respectively.
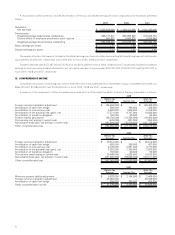
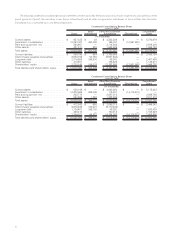
A summary of the components of other comprehensive income (loss) and the related tax effects for each of the years presented is as follows:
Before-Tax
Amount Income Tax
After-Tax
Amount
2009
Foreign currency translation adjustment ............................ $ (84,452,000) $ — $ (84,452,000)
Amortization of cash flow hedge . . ............................... 694,000 266,000 428,000
Amortization of prior service cost. . ............................... 3,923,000 1,505,000 2,418,000
Amortization of net actuarial loss (gain), net ......................... 17,571,000 6,747,000 10,824,000
Amortization of transition obligation ............................... 153,000 60,000 93,000
Pension liability assumption .................................... (26,704,000) (10,254,000) (16,450,000)
Prior service cost arising in current year ............................ (575,000) (221,000) (354,000)
Net actuarial (loss) gain, net arising in current year . .................... (197,604,000) (75,879,000) (121,725,000)
Other comprehensive loss ..................................... $ (286,994,000) $ (77,776,000) $ (209,218,000)
Before-Tax
Amount Income Tax
After-Tax
Amount
2008
Foreign currency translation adjustment ............................ $ 30,514,000 $ — $ 30,514,000
Amortization of cash flow hedge . . ............................... 693,000 266,000 427,000
Amortization of prior service cost. . ............................... 6,128,000 2,351,000 3,777,000
Amortization of net actuarial loss (gain), net ......................... 3,253,000 1,250,000 2,003,000
Amortization of transition obligation ............................... 153,000 60,000 93,000
Prior service credit arising in current year ........................... 30,048,000 11,538,000 18,510,000
Net actuarial (loss) gain, net arising in current year . .................... (231,836,000) (89,025,000) (142,811,000)
Other comprehensive loss ..................................... $ (161,047,000) $ (73,560,000) $ (87,487,000)
Before-Tax
Amount Income Tax
After-Tax
Amount
2007
Minimum pension liability adjustment. ............................. $ 5,633,000 $ 2,164,000 $ 3,469,000
Foreign currency translation adjustment ............................ 25,052,000 — 25,052,000
Amortization of cash flow hedge . . ............................... 694,000 266,000 428,000
Other comprehensive income ................................... $ 31,379,000 $ 2,430,000 $ 28,949,000
52