Sysco 2009 Annual Report Download - page 34
Download and view the complete annual report
Please find page 34 of the 2009 Sysco annual report below. You can navigate through the pages in the report by either clicking on the pages listed below, or by using the keyword search tool below to find specific information within the annual report.-
 1
1 -
2
-
3
-
4
-
5
-
6
-
7
-
8
-
9
-
10
-
11
-
12
-
13
-
14
-
15
-
16
-
17
-
18
-
19
-
20
-
21
-
22
-
23
-
 24
24 -
 25
25 -
 26
26 -
 27
27 -
 28
28 -
 29
29 -
 30
30 -
 31
31 -
 32
32 -
 33
33 -
 34
34 -
 35
35 -
 36
36 -
 37
37 -
 38
38 -
 39
39 -
 40
40 -
 41
41 -
 42
42 -
 43
43 -
 44
44 -
45
-
46
-
47
-
48
-
49
-
50
-
51
-
52
-
53
-
54
-
55
-
56
-
57
-
58
-
59
-
60
-
61
-
62
-
63
-
64
-
65
-
66
-
67
-
68
-
69
-
70
-
71
-
72
-
73
-
74
-
75
-
76
-
77
-
78
-
79
-
80
-
81
-
82
-
83
-
84
-
85
-
86
-
87
-
88
-
89
-
90
-
91
-
92
 |
 |
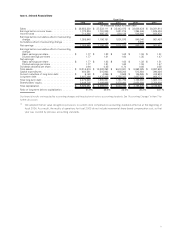
Sales
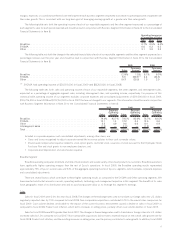
Sales for fiscal 2009 were 1.8% less than fiscal 2008. Product cost inflation and the resulting increase in selling prices had a significant impact
on sales levels in fiscal 2009. Estimated product cost increases, an internal measure of inflation, were approximately 4.7% during fiscal 2009. The
changes in the exchange rates used to translate our foreign sales into U.S. dollars negatively impacted sales by 1.2% compared to fiscal 2008. Non-
comparable acquisitions offset the rate of sales decline by 0.2% for fiscal 2009.
Sales for fiscal 2008 were 7.1% greater than fiscal 2007. Product cost inflation and the resulting increase in selling prices had a significant
impact on sales levels in fiscal 2008. Estimated product cost increases, an internal measure of inflation, were approximately 6.0% during fiscal
2008.The changes in the exchange rates used to translate our foreign sales into U.S. dollars increased sales by 1.0% compared to fiscal 2007. Non-
comparable acquisitions contributed 0.1% to the overall sales growth rate for fiscal 2008.
Our sequential quarterly sales trend has demonstrated a continuing decline throughout fiscal 2008 and 2009 from a positive 8.5% in the first
quarter of fiscal 2008 to a negative 6.6% in the fourth quarter of fiscal 2009. We believe the deteriorating economic conditions, which are placing
pressure on consumer disposable income, are contributing to a decline in real volume in the foodservice market and, in turn, have contributed to a
reduction in our sales. We believe we will continue to experience a difficult economic environment into fiscal 2010. Thus far in fiscal 2010, we have
experienced moderate deflation. Both of these conditions will make it challenging to grow sales in fiscal 2010; however, if underlying economic
conditions improve during fiscal 2010, we believe our trend of sequential quarterly sales decline may reverse.
We believe that our continued focus on the use of business reviews and business development activities, investment in customer contact
personnel and the efforts of our marketing associates and sales support personnel are key drivers to strengthening customer relationships and
growing sales with new and existing customers. We also believe these activities help our customers in this difficult economic environment.
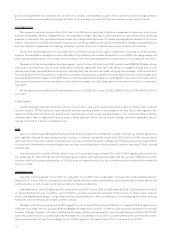
Operating Income
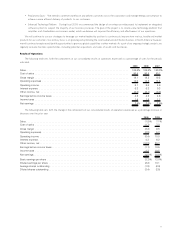
Cost of sales primarily includes product costs, net of vendor consideration and in-bound freight. Operating expenses include the costs of
facilities, product handling, delivery, selling and general and administrative activities.
Operating income decreased 0.4% in fiscal 2009 from fiscal 2008 to $1,872,211,000, or 5.1% of sales. Operating income declined primarily due
to a decline in sales, partially offset by a decline in operating expenses. Gross margin dollars decreased 2.2% in fiscal 2009 as compared to fiscal
2008, and operating expenses decreased 2.8% in fiscal 2009.
Operating income increased 10.0% in fiscal 2008 over fiscal 2007 to $1,879,949,000, or 5.0% of sales. Operating income increased primarily
due to an increase in sales, partially offset by an increase in operating expenses. Gross margin dollars increased 6.5% in fiscal 2008 as compared to
fiscal 2007, and operating expenses increased 5.3% in fiscal 2008.
Beginning in the fourth quarter of fiscal 2007, Sysco began experiencing high levels of product cost increases in numerous product categories.
These increases persisted throughout fiscal 2008 at levels approximating 6.0% and rose even higher to 7.6% in the first 26 weeks of fiscal 2009.
The level of product cost increases began moderating during the third quarter of fiscal 2009 and was 0.5% in the fourth quarter of fiscal 2009.
Generally, Sysco attempts to pass increased costs to its customers; however, because of contractual and competitive reasons, we are not able to
pass along all of the product cost increases immediately. Prolonged periods of high inflation, such as those we have recently experienced, have a
negative impact on our customers, as high food costs and fuel costs can reduce consumer spending in the food-prepared-away-from home market.
As a result, these factors may negatively impact our sales, gross margins and earnings. We may also be negatively impacted by periods of prolonged
product cost deflation because we make a significant portion of our sales at prices that are based on the cost of products we sell plus a percentage
markup. As a result, our profit levels may be negatively impacted during periods of product cost deflation, even though our gross profit percentage
may remain relatively constant.
We believe the operating expense performance for fiscal 2009 compared to fiscal 2008 was aided by operating efficiencies and lower payroll
expense related to reduced headcount and lower incentive compensation.The positive impact of these expense reductions was partially offset by the
combined effect of increased losses on the adjustment of the carrying value of corporate-owned life insurance policies to their cash surrender values
and an increase in the provision for losses on receivables. In addition, our fuel costs increased during fiscal 2009 compared to fiscal 2008.
Operating expenses in fiscal 2008 compared to fiscal 2007 were negatively impacted by the combined impact of losses on the adjustment of
the carrying value of corporate-owned life insurance policies to their cash surrender values and increased provisions related to multi-employer
pension plans. The negative impact of these expense increases was partially offset by lower share-based compensation expense and lower
company-sponsored pension expenses. In addition, our fuel costs increased during fiscal 2008 compared to fiscal 2007. We increased our use of
fuel surcharges to offset a portion of these increased costs, thereby partially reducing the impact to operating income.
We adjust the carrying values of our corporate-owned life insurance policies to their cash surrender values on an ongoing basis. The cash
surrender values of these policies are largely based on the values of underlying investments, which include publicly traded securities. As a result, the
cash surrender values of these policies will fluctuate with changes in the market value of such securities. The performance in the financial markets
resulted in losses for these policies of $43,812,000 in fiscal 2009, losses of $8,718,000 in fiscal 2008 and gains of $23,922,000 in fiscal 2007.The
performance of the financial markets will continue to influence the cash surrender values of our corporate-owned life insurance policies, which could
cause volatility in operating income, net earnings and earnings per share.
14