Sysco 2009 Annual Report Download - page 59
Download and view the complete annual report
Please find page 59 of the 2009 Sysco annual report below. You can navigate through the pages in the report by either clicking on the pages listed below, or by using the keyword search tool below to find specific information within the annual report.-
 1
1 -
2
-
3
-
4
-
5
-
6
-
7
-
8
-
9
-
10
-
11
-
12
-
13
-
14
-
15
-
16
-
17
-
18
-
19
-
20
-
21
-
22
-
23
-
24
-
25
-
26
-
27
-
28
-
29
-
30
-
31
-
32
-
33
-
34
-
35
-
36
-
37
-
38
-
39
-
40
-
41
-
42
-
43
-
44
-
45
-
46
-
47
-
48
-
 49
49 -
 50
50 -
 51
51 -
 52
52 -
 53
53 -
 54
54 -
 55
55 -
 56
56 -
 57
57 -
 58
58 -
 59
59 -
 60
60 -
 61
61 -
 62
62 -
 63
63 -
 64
64 -
 65
65 -
 66
66 -
 67
67 -
 68
68 -
 69
69 -
70
-
71
-
72
-
73
-
74
-
75
-
76
-
77
-
78
-
79
-
80
-
81
-
82
-
83
-
84
-
85
-
86
-
87
-
88
-
89
-
90
-
91
-
92
 |
 |

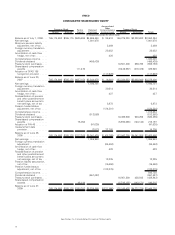
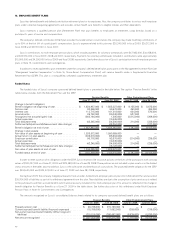
SYSCO
CONSOLIDATED CASH FLOWS
June 27, 2009 June 28, 2008 June 30, 2007
Year Ended
(In thousands)
Cash flows from operating activities:
Net earnings ..................................................... $1,055,948 $1,106,151 $1,001,076
Adjustments to reconcile net earnings to cash provided by operating activities:
Share-based compensation expense ................................... 56,030 80,650 97,985
Depreciation and amortization. . . ..................................... 382,339 372,529 362,559
Deferred tax (benefit) provision . . ..................................... (294,162) 643,480 545,971
Provision for losses on receivables .................................... 74,638 32,184 28,156
(Gain) on sale of assets ............................................ (3,586) (2,747) (6,279)
Additional investment in certain assets and liabilities, net of effect of businesses
acquired:
Decrease (increase) in receivables. .................................... 188,748 (128,017) (134,153)
Decrease (increase) in inventories . .................................... 177,590 (110,925) (95,932)
(Increase) decrease in prepaid expenses and other current assets .............. (678) 59,896 (62,773)
(Decrease) increase in accounts payable ................................ (192,692) 54,451 85,422
(Decrease) increase in accrued expenses . ............................... (120,314) (22,721) 132,936
Increase (decrease) in accrued income taxes . . . .......................... 325,482 (509,783) (491,993)
(Increase) decrease in other assets . ................................... (15,701) 11,926 (36,426)
(Decrease) increase in other long-term liabilities and prepaid pension cost, net . . . . . . (48,380) 13,459 (14,817)
Excess tax benefits from share-based compensation arrangements ............. (2,921) (4,404) (8,810)
Net cash provided by operating activities ................................. 1,582,341 1,596,129 1,402,922
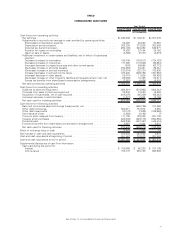
Cash flows from investing activities:
Additions to plant and equipment . . ..................................... (464,561) (515,963) (603,242)
Proceeds from sales of plant and equipment . .............................. 25,244 13,320 16,008
Acquisition of businesses, net of cash acquired . . . .......................... (218,075) (55,259) (59,322)
(Increase) decrease in restricted cash . ................................... (1,271) 2,342 (2,155)
Net cash used for investing activities .................................... (658,663) (555,560) (648,711)
Cash flows from financing activities:
Bank and commercial paper borrowings (repayments), net ..................... — (550,726) 121,858
Other debt borrowings .............................................. 506,611 757,972 5,290
Other debt repayments. ............................................. (10,173) (7,628) (109,656)
Debt issuance costs . ............................................... (3,693) (4,192) (7)
Common stock reissued from treasury . .................................. 111,780 128,238 221,736
Treasury stock purchases ............................................ (438,843) (529,179) (550,865)
Dividends paid . ................................................... (548,246) (497,467) (445,416)
Excess tax benefits from share-based compensation arrangements . .............. 2,921 4,404 8,810
Net cash used for financing activities .................................... (379,643) (698,578) (748,250)
Effect of exchange rates on cash . . . ..................................... (8,503) 1,689 14
Net increase in cash and cash equivalents .................................. 535,532 343,680 5,975
Cash and cash equivalents at beginning of period . . . .......................... 551,552 207,872 201,897
Cash and cash equivalents at end of period ................................. $1,087,084 $ 551,552 $ 207,872
Supplemental disclosures of cash flow information:
Cash paid during the period for:
Interest ....................................................... $ 108,608 $ 98,330 $ 107,109
Income taxes . . . ................................................ 735,772 530,169 563,968
See Notes to Consolidated Financial Statements
39