Sysco 2009 Annual Report Download - page 40
Download and view the complete annual report
Please find page 40 of the 2009 Sysco annual report below. You can navigate through the pages in the report by either clicking on the pages listed below, or by using the keyword search tool below to find specific information within the annual report.-
 1
1 -
2
-
3
-
4
-
5
-
6
-
7
-
8
-
9
-
10
-
11
-
12
-
13
-
14
-
15
-
16
-
17
-
18
-
19
-
20
-
21
-
22
-
23
-
24
-
25
-
26
-
27
-
28
-
29
-
 30
30 -
 31
31 -
 32
32 -
 33
33 -
 34
34 -
 35
35 -
 36
36 -
 37
37 -
 38
38 -
 39
39 -
 40
40 -
 41
41 -
 42
42 -
 43
43 -
 44
44 -
 45
45 -
 46
46 -
 47
47 -
 48
48 -
 49
49 -
 50
50 -
51
-
52
-
53
-
54
-
55
-
56
-
57
-
58
-
59
-
60
-
61
-
62
-
63
-
64
-
65
-
66
-
67
-
68
-
69
-
70
-
71
-
72
-
73
-
74
-
75
-
76
-
77
-
78
-
79
-
80
-
81
-
82
-
83
-
84
-
85
-
86
-
87
-
88
-
89
-
90
-
91
-
92
 |
 |

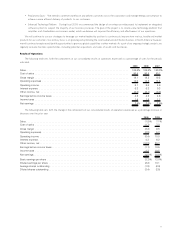
In fiscal 2007, we recorded a liability for a product liability claim of $50,296,000 and the corresponding insurance receivable of $48,296,000,
included within prepaid expenses and other current assets. In fiscal 2008, these amounts were reversed as our insurance carrier and other parties
paid the full amount of the judgment in excess of our deductible. See further discussion of the product liability claim under Note 19, Commitments
and Contingencies, in the Notes to Consolidated Financial Statements in Item 8.
Other long-term liabilities and prepaid pension cost, net, decreased $48,380,000 during fiscal 2009, increased $13,459,000 during fiscal
2008 and decreased $14,817,000 in fiscal 2007. The decrease in fiscal 2009 is primarily attributable to a decrease in our liability for uncertain tax
benefits. See additional discussion of an IRS settlement at “Liquidity and Capital Resources, Other Considerations.” The decrease was partially offset
by a combination of the recording of net company-sponsored pension costs and incentive compensation deferrals. The increase for fiscal 2008 was
primarily attributable to a combination of the recording of net company-sponsored pension costs, incentive compensation deferrals and a net
increase to our liability for unrecognized tax benefits, partially offset by pension contributions to our company-sponsored plans. The decrease in
fiscal 2007 was due to pension contributions to our company-sponsored plans exceeding the amount of net company-sponsored pension costs
recognized during the year.We recorded net company-sponsored pension costs of $88,714,000, $65,837,000 and $74,591,000 during fiscal 2009,
fiscal 2008 and fiscal 2007, respectively. Our contributions to our company-sponsored defined benefit plans were $95,776,000, $92,670,000 and
$91,163,000 during fiscal 2009, fiscal 2008 and fiscal 2007, respectively. We expect to contribute approximately $160,000,000 to our company-
sponsored defined benefit plans in fiscal 2010.
Investing Activities
Fiscal 2009 capital expenditures included:
• construction of a fold-out facility in Longview, Texas;
• replacement or significant expansion of facilities in Victoria, British Columbia; Chicago, Illinois; Pittsburgh, Pennsylvania and Houston,
Texas;
• land purchases for future fold-out facilities; and
• investments in our project to enhance our technology platform.
Fiscal 2008 capital expenditures included:
• construction of fold-out facilities in Knoxville, Tennessee and Longview, Texas;
• replacement or significant expansion of facilities in Atlanta, Georgia; Chicago, Illinois; Peterborough, Ontario and Houston, Texas;
• completion of the Southeast RDC in Alachua, Florida; and
• completion of work on the corporate headquarters expansion.
Fiscal 2007 capital expenditures included:
• construction of a fold-out facility in Raleigh, North Carolina;
• replacement or significant expansion of facilities in Edmonton, Alberta; Los Angeles, California; Miami, Florida; Albuquerque, New Mexico
and Columbia, South Carolina;
• the Southeast RDC in Alachua, Florida; and
• continuing work on the corporate headquarters expansion.
We expect total capital expenditures in fiscal 2010 to be in the range of $600,000,000 to $650,000,000. Fiscal 2010 expenditures will include
the continuation of the fold-out program; facility, fleet and other equipment replacements and expansions; and investments in technology.
During fiscal 2009, in the aggregate, the company paid cash of $218,075,000 for operations acquired during fiscal 2009 and for contingent
consideration related to operations acquired in previous fiscal years. During fiscal 2009, we acquired for cash broadline foodservice operations in
Ireland, Los Angeles, California and Boston, Massachusetts, as well as a produce distributor in Toronto, Ontario.
Financing Activities
Equity
We traditionally have engaged in Board-approved share repurchase programs. The number of shares acquired and their cost during the past
three fiscal years were 16,951,200 shares for $438,843,000 in fiscal 2009, 16,769,900 shares for $529,179,000 in fiscal 2008 and
16,231,200 shares for $550,865,000 in fiscal 2007. As of August 12, 2009, there was a remaining authorization by our Board of Directors to
repurchase up to 9,386,600 shares. We expect to repurchase significantly fewer shares in fiscal 2010 than in previous years.
Dividends paid were $548,246,000, or $0.92 per share, in fiscal 2009, $497,467,000, or $0.82 per share, in fiscal 2008 and $445,416,000, or
$0.72 per share, in fiscal 2007. In May 2009, we declared our regular quarterly dividend for the first quarter of fiscal 2010 of $0.24 per share, which
was paid in July 2009.
In November 2000, we filed with the SEC a shelf registration statement covering 30,000,000 shares of common stock to be offered from time
to time in connection with acquisitions. As of August 12, 2009, 29,477,835 shares remained available for issuance under this registration statement.
20