Sysco 2009 Annual Report Download - page 33
Download and view the complete annual report
Please find page 33 of the 2009 Sysco annual report below. You can navigate through the pages in the report by either clicking on the pages listed below, or by using the keyword search tool below to find specific information within the annual report.-
 1
1 -
2
-
3
-
4
-
5
-
6
-
7
-
8
-
9
-
10
-
11
-
12
-
13
-
14
-
15
-
16
-
17
-
18
-
19
-
20
-
21
-
22
-
 23
23 -
 24
24 -
 25
25 -
 26
26 -
 27
27 -
 28
28 -
 29
29 -
 30
30 -
 31
31 -
 32
32 -
 33
33 -
 34
34 -
 35
35 -
 36
36 -
 37
37 -
 38
38 -
 39
39 -
 40
40 -
 41
41 -
 42
42 -
 43
43 -
44
-
45
-
46
-
47
-
48
-
49
-
50
-
51
-
52
-
53
-
54
-
55
-
56
-
57
-
58
-
59
-
60
-
61
-
62
-
63
-
64
-
65
-
66
-
67
-
68
-
69
-
70
-
71
-
72
-
73
-
74
-
75
-
76
-
77
-
78
-
79
-
80
-
81
-
82
-
83
-
84
-
85
-
86
-
87
-
88
-
89
-
90
-
91
-
92
 |
 |

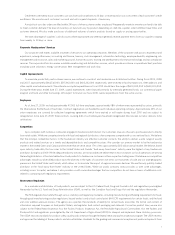
•Productivity Gains: We intend to optimize warehouse and delivery activities across the corporation and manage energy consumption to
achieve a more efficient delivery of products to our customers.
•Enhanced Technology Platform: During fiscal 2009, we commenced the design of an enterprise-wide project to implement an integrated
software system to support the majority of our business processes. The goal of the project is to create a new technology platform that
simplifies and standardizes our business model, which we believe will improve the efficiency and effectiveness of our operations.
We will continue to use our strategies to leverage our market leadership position to continuously improve how we buy, handle and market
products for our customers. Our primary focus is on growing and optimizing the core foodservice distribution business in North America; however,
we will continue to explore and identify opportunities to grow our global capabilities in other markets. As a part of our ongoing strategic analysis, we
regularly evaluate business opportunities, including potential acquisitions and sales of assets and businesses.
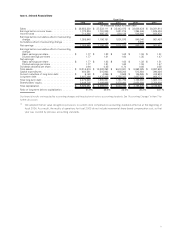
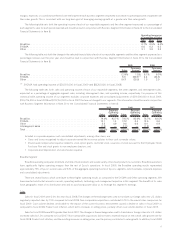
Results of Operations
The following table sets forth the components of our consolidated results of operations expressed as a percentage of sales for the periods
indicated:
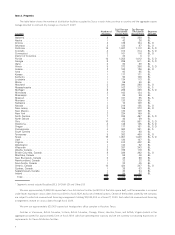
2009 2008 2007
Sales. . ................................................................... 100.0% 100.0% 100.0%
Cost of sales ............................................................... 80.9 80.8 80.7
Gross margin . .............................................................. 19.1 19.2 19.3
Operating expenses . . ........................................................ 14.0 14.2 14.4
Operating income . ........................................................... 5.1 5.0 4.9
Interest expense ............................................................ 0.3 0.3 0.3
Other income, net . . . ........................................................ (0.0) (0.1) (0.0)
Earnings before income taxes ................................................... 4.8 4.8 4.6
Income taxes . .............................................................. 1.9 1.8 1.7
Net earnings ............................................................... 2.9% 3.0% 2.9%
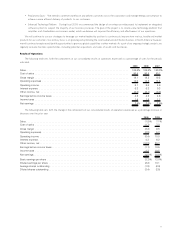
The following table sets forth the change in the components of our consolidated results of operations expressed as a percentage increase or
decrease over the prior year:
2009 2008
Sales . ........................................................................... (1.8)% 7.1%
Cost of sales ...................................................................... (1.7) 7.2
Gross margin ...................................................................... (2.2) 6.5
Operating expenses. . ................................................................ (2.8) 5.3
Operating income . . . ................................................................ (0.4) 10.0
Interest expense . ................................................................... 4.3 6.2
Other income, net . . . ................................................................ (34.8) 29.3
Earnings before income taxes . .......................................................... (1.1) 10.5
Income taxes ...................................................................... 4.3 10.5
Net earnings . ...................................................................... (4.5)% 10.5%
Basic earnings per share .............................................................. (3.3)% 13.0%
Diluted earnings per share ............................................................. (2.2) 13.1
Average shares outstanding ............................................................ (1.8) (2.0)
Diluted shares outstanding ............................................................. (2.4) (2.5)
13