Sysco 2009 Annual Report Download - page 37
Download and view the complete annual report
Please find page 37 of the 2009 Sysco annual report below. You can navigate through the pages in the report by either clicking on the pages listed below, or by using the keyword search tool below to find specific information within the annual report.-
 1
1 -
2
-
3
-
4
-
5
-
6
-
7
-
8
-
9
-
10
-
11
-
12
-
13
-
14
-
15
-
16
-
17
-
18
-
19
-
20
-
21
-
22
-
23
-
24
-
25
-
26
-
 27
27 -
 28
28 -
 29
29 -
 30
30 -
 31
31 -
 32
32 -
 33
33 -
 34
34 -
 35
35 -
 36
36 -
 37
37 -
 38
38 -
 39
39 -
 40
40 -
 41
41 -
 42
42 -
 43
43 -
 44
44 -
 45
45 -
 46
46 -
 47
47 -
48
-
49
-
50
-
51
-
52
-
53
-
54
-
55
-
56
-
57
-
58
-
59
-
60
-
61
-
62
-
63
-
64
-
65
-
66
-
67
-
68
-
69
-
70
-
71
-
72
-
73
-
74
-
75
-
76
-
77
-
78
-
79
-
80
-
81
-
82
-
83
-
84
-
85
-
86
-
87
-
88
-
89
-
90
-
91
-
92
 |
 |

margins, expenses, or a combination thereof, over the long-term each business segment is expected to increase its operating income at a greater rate
than sales growth. This is consistent with our long-term goal of leveraging earnings growth at a greater rate than sales growth.
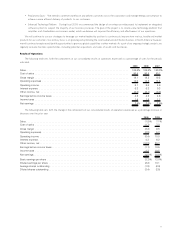
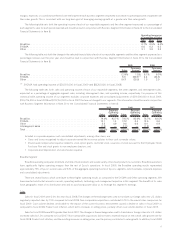
The following table sets forth the operating income of each of our reportable segments and the other segment expressed as a percentage of
each segment’s sales for each period reported and should be read in conjunction with Business Segment Information in Note 20 to the Consolidated
Financial Statements in Item 8:
2009 2008 2007
Operating Income as
a Percentage of Sales
Broadline......................................................................... 6.7% 6.5% 6.4%
SYGMA ......................................................................... 0.6 0.2 0.3
Other ........................................................................... 3.1 3.8 3.8
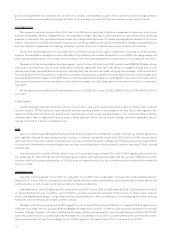
The following table sets forth the change in the selected financial data of each of our reportable segments and the other segment expressed as a
percentage increase over the prior year and should be read in conjunction with Business Segment Information in Note 20 to the Consolidated
Financial Statements in Item 8:
Sales
Operating
Income Sales
Operating
Income
2009 2008
Broadline .......................................................... (2.0)% 1.5% 8.1% 9.0%
SYGMA ........................................................... 5.8 265.5
(1)
4.4 (23.8)
Other ............................................................. (9.7) (25.8) 1.5 3.0
(1)
SYGMA had operating income of $30,193,000 in fiscal 2009 and $8,261,000 in fiscal 2008.
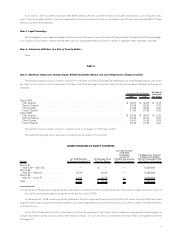
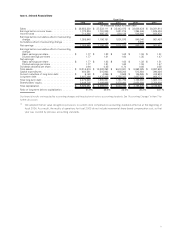
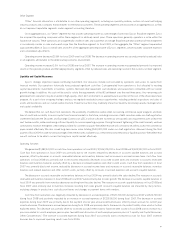
The following table sets forth sales and operating income of each of our reportable segments, the other segment, and intersegment sales,
expressed as a percentage of aggregate segment sales, including intersegment sales, and operating income, respectively. For purposes of this
statistical table, operating income of our segments excludes corporate expenses and consolidated adjustments of $219,300,000 in fiscal 2009,
$196,726,000 in fiscal 2008 and $207,361,000 in fiscal 2007 that are not charged to our segments.This information should be read in conjunction
with Business Segment Information in Note 20 to the Consolidated Financial Statements in Item 8:
Sales
Segment
Operating
Income Sales
Segment
Operating
Income Sales
Segment
Operating
Income
2009 2008 2007
Broadline ............................................. 79.4% 93.7% 79.5% 93.0% 78.7% 92.5%
SYGMA .............................................. 13.1 1.4 12.2 0.4 12.5 0.6
Other ............................................... 8.8 4.9 9.6 6.6 10.1 6.9
Intersegment sales ...................................... (1.3) — (1.3) — (1.3) —
Total ................................................ 100.0% 100.0% 100.0% 100.0% 100.0% 100.0%
Included in corporate expenses and consolidated adjustments, among other items, are:
• Gains and losses recognized to adjust corporate-owned life insurance policies to their cash surrender values;
• Share-based compensation expense related to stock option grants, restricted stock, issuances of stock pursuant to the Employees’ Stock
Purchase Plan and stock grants to non-employee directors; and
• Corporate-level depreciation and amortization expense.
Broadline Segment
Broadline operating companies distribute a full line of food products and a wide variety of non-food products to customers. Broadline operations
have significantly higher operating margins than the rest of Sysco’s operations. In fiscal 2009, the Broadline operating results represented
approximately 79% of Sysco’s overall sales and 94% of the aggregate operating income of Sysco’s segments, which excludes corporate expenses
and consolidated adjustments.
There are several factors which contribute to these higher operating results as compared to the SYGMA and Other operating segments. We
have invested substantial amounts in assets, operating methods, technology and management expertise in this segment. The breadth of its sales
force, geographic reach of its distribution area and its purchasing power allow us to leverage this segment’s earnings.
Sales
Sales for fiscal 2009 were 2.0% less than fiscal 2008. The changes in the exchange rates used to translate our foreign sales into U.S. dollars
negatively impacted sales by 1.5% compared to fiscal 2008. Non-comparable acquisitions contributed 0.2% to the overall sales comparison for
fiscal 2009. Case volume declines attributable to the impact of the current business environment caused a decline in sales in fiscal 2009 as
compared to fiscal 2008. Product cost inflation, which led to increases in selling prices, partially offset case volume declines in fiscal 2009.
Sales for fiscal 2008 were 8.1% greater than fiscal 2007. The changes in the exchange rates used to translate our foreign sales into U.S. dollars
increased sales by 1.3% compared to fiscal 2007. Non-comparable acquisitions did not have a material impact on the overall sales growth rate for
fiscal 2008. Product cost inflation, and the resulting increases in selling prices, was the primary contributor to sales growth. In addition, fiscal 2008
17