Sysco 2009 Annual Report Download - page 76
Download and view the complete annual report
Please find page 76 of the 2009 Sysco annual report below. You can navigate through the pages in the report by either clicking on the pages listed below, or by using the keyword search tool below to find specific information within the annual report.-
 1
1 -
2
-
3
-
4
-
5
-
6
-
7
-
8
-
9
-
10
-
11
-
12
-
13
-
14
-
15
-
16
-
17
-
18
-
19
-
20
-
21
-
22
-
23
-
24
-
25
-
26
-
27
-
28
-
29
-
30
-
31
-
32
-
33
-
34
-
35
-
36
-
37
-
38
-
39
-
40
-
41
-
42
-
43
-
44
-
45
-
46
-
47
-
48
-
49
-
50
-
51
-
52
-
53
-
54
-
55
-
56
-
57
-
58
-
59
-
60
-
61
-
62
-
63
-
64
-
65
-
 66
66 -
 67
67 -
 68
68 -
 69
69 -
 70
70 -
 71
71 -
 72
72 -
 73
73 -
 74
74 -
 75
75 -
 76
76 -
 77
77 -
 78
78 -
 79
79 -
 80
80 -
 81
81 -
 82
82 -
 83
83 -
 84
84 -
 85
85 -
 86
86 -
87
-
88
-
89
-
90
-
91
-
92
 |
 |

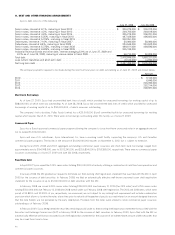
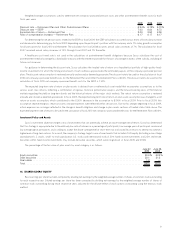
Cash received from option exercises and purchases of shares under the Employees’ Stock Purchase Plan was $111,779,000, $128,238,000 and
$221,338,000 during fiscal 2009, 2008 and 2007, respectively. The actual tax benefit realized for the tax deductions from option exercises totaled
$7,382,000, $9,371,000, and $22,575,000 during fiscal 2009, 2008 and 2007, respectively.
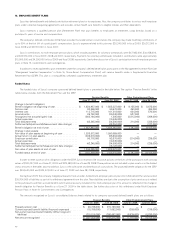
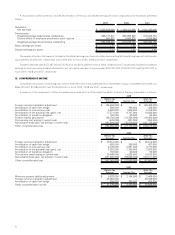
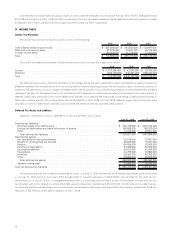
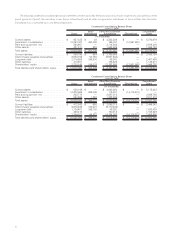
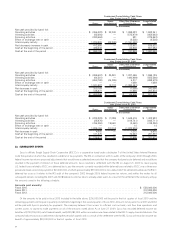
17. INCOME TAXES
Income Tax Provisions
The income tax provision for each fiscal year consists of the following:
2009 2008 2007
United States federal income taxes. ............................... $ 602,595,000 $ 584,584,000 $ 539,997,000
State and local income taxes .................................... 87,223,000 79,587,000 63,139,000
Foreign income taxes . . ....................................... 25,068,000 21,016,000 17,003,000
Total . . . .................................................. $ 714,886,000 $ 685,187,000 $ 620,139,000
The current and deferred components of the income tax provisions for each fiscal year are as follows:
2009 2008 2007
Current. ................................................... $ 1,010,595,000 $ 42,830,000 $ 53,805,000
Deferred. .................................................. (295,709,000) 642,357,000 566,334,000
Total ..................................................... $ 714,886,000 $ 685,187,000 $ 620,139,000
The deferred tax provisions result from the effects of net changes during the year in deferred tax assets and liabilities arising from temporary
differences between the carrying amounts of assets and liabilities for financial reporting purposes and the amounts used for income tax purposes. In
addition to the deferred tax provision, changes in the deferred tax liability balances in fiscal 2009 are impacted by an Internal Revenue Service (IRS)
settlement, see Note 22, Subsequent Events. Fiscal 2008 and 2007 deferred tax liability balances were also impacted by the reclassification of
deferred supply chain distributions from current deferred tax liabilities to accrued income taxes based on the timing of when payments related to
these items became payable. This reclassification was $575,248,000 in fiscal 2008. In fiscal 2008, deferred supply chain distributions were
classified as current or deferred tax liabilities based on when the related income tax payments were payable.
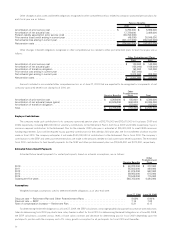
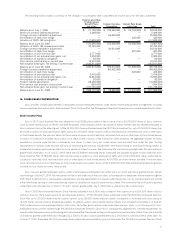
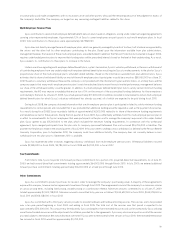
Deferred Tax Assets and Liabilities
Significant components of Sysco’s deferred tax assets and liabilities are as follows:
June 27, 2009 June 28, 2008
Deferred tax liabilities:
Deferred supply chain distributions . . ........................................ $ 750,755,000 $ 1,054,190,000
Excess tax depreciation and basis differences of assets ........................... 395,656,000 369,203,000
Other .............................................................. 14,190,000 20,601,000
Total deferred tax liabilities . ............................................. 1,160,601,000 1,443,994,000
Deferred tax assets:
Net operating tax loss carryforwards. ........................................ 75,079,000 73,481,000
Benefit on unrecognized tax benefits ........................................ 55,609,000 73,837,000
Pension. ............................................................ 156,809,000 76,500,000
Deferred compensation. ................................................. 54,485,000 54,805,000
Self-insured liabilities ................................................... 40,912,000 41,390,000
Receivables . ......................................................... 44,799,000 30,650,000
Inventory . ........................................................... 39,491,000 40,355,000
Other .............................................................. 29,669,000 35,535,000
Total deferred tax assets ............................................... 496,853,000 426,553,000
Valuation allowances. ................................................... 24,994,000 39,020,000
Total net deferred tax liabilities .............................................. $ 688,742,000 $ 1,056,461,000
The company had state and Canadian net operating tax losses as of June 27, 2009 and June 28, 2008.The net operating tax losses outstanding
as of June 27, 2009 expire in fiscal years 2010 through 2029. A valuation allowance of $24,994,000 was recorded for the state tax loss
carryforwards as of June 27, 2009, as management believes that it is more likely than not that a portion of the benefits of these state tax loss
carryforwards will not be realized. As of June 28, 2008, valuation allowances recorded were $39,020,000 for both state and Canadian tax loss
carryforwards. Both the net operating tax loss carryforwards and the valuation allowances were impacted by the company’s adoption of FIN 48 by a
reduction of $14,705,000 at the date of adoption on July 1, 2008.
56