Toyota 2014 Annual Report Download - page 26
Download and view the complete annual report
Please find page 26 of the 2014 Toyota annual report below. You can navigate through the pages in the report by either clicking on the pages listed below, or by using the keyword search tool below to find specific information within the annual report.-
 1
1 -
2
-
3
-
4
-
5
-
6
-
7
-
8
-
9
-
10
-
11
-
12
-
13
-
14
-
15
-
 16
16 -
 17
17 -
 18
18 -
 19
19 -
 20
20 -
 21
21 -
 22
22 -
 23
23 -
 24
24 -
 25
25 -
 26
26 -
 27
27 -
 28
28 -
 29
29 -
 30
30 -
 31
31 -
 32
32 -
 33
33 -
 34
34 -
 35
35 -
 36
36 -
37
-
38
-
39
-
40
-
41
-
42
-
43
-
44
-
45
-
46
-
47
-
48
-
49
-
50
-
51
-
52
-
53
-
54
-
55
-
56
-
57
-
58
-
59
-
60
-
61
-
62
-
63
-
64
-
65
-
66
-
67
-
68
 |
 |

[1 of 3]
ANNUAL REPORT 2014
President’s MessagePresident’s Message
Overview of
Four Business Units
Overview of
Four Business Units
Special FeatureSpecial Feature
Review of OperationsReview of Operations
Consolidated Performance
Highlights
Consolidated Performance
Highlights
Management and
Corporate Information
Management and
Corporate Information
Investor InformationInvestor Information
Financial SectionFinancial Section
Page 26
NextPrev
ContentsSearchPrint
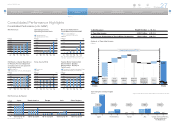
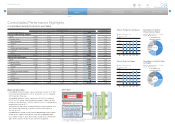
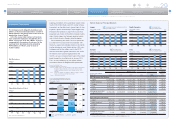
Consolidated Performance Highlights
Consolidated Performance (U.S. GAAP)
Millions of yen % change
2010 2011 2012 2013 2014 2014 vs. 2013
Fiscal years ended March 31
Net Revenues: 18,950,973 18,993,688 18,583,653 22,064,192 25,691,911 +16.4
Automotive 17,197,428 17,337,320 16,994,546 20,419,100 23,781,404 +16.5
Financial Services 1,245,407 1,192,205 1,100,324 1,170,670 1,421,047 +21.4
All Other 947,615 972,252 1,048,915 1,066,461 1,151,280 +8.0
Inter-Segment Elimination (439,477) (508,089) (560,132) (592,039) (661,820) —
Operating Income: 147,516 468,279 355,627 1,320,888 2,292,112 +73.5
Automotive (86,370) 85,973 21,683 944,704 1,938,778 +105.2
Financial Services 246,927 358,280 306,438 315,820 294,891 –6.6
All Other (8,860) 35,242 42,062 53,616 64,270 +19.9
Inter-Segment Elimination (4,181) (11,216) (14,556) 6,748 (5,827) —
Net Income Attributable to Toyota Motor Corporation*2209,456 408,183 283,559 962,163 1,823,119 +89.5
ROE 2.1% 3.9% 2.7% 8.5% 13.7% —
ROA 0.7% 1.4% 0.9% 2.9% 4.7% —
As of March 31
Total Assets 30,349,287 29,818,166 30,650,965 35,483,317 41,437,473 +16.8
Toyota Motor Corporation Shareholders’ Equity 10,359,723 10,332,371 10,550,261 12,148,035 14,469,148 +19.1
Short-Term Debt, Including Current Portion of Long-Term Debt 5,497,997 5,951,836 5,963,269 6,793,956 7,780,483 +14.5
Long-Term Debt, less Current Portion 7,015,409 6,449,220 6,042,277 7,337,824 8,546,910 +16.5