Toyota 2014 Annual Report Download - page 27
Download and view the complete annual report
Please find page 27 of the 2014 Toyota annual report below. You can navigate through the pages in the report by either clicking on the pages listed below, or by using the keyword search tool below to find specific information within the annual report.-
 1
1 -
2
-
3
-
4
-
5
-
6
-
7
-
8
-
9
-
10
-
11
-
12
-
13
-
14
-
15
-
16
-
 17
17 -
 18
18 -
 19
19 -
 20
20 -
 21
21 -
 22
22 -
 23
23 -
 24
24 -
 25
25 -
 26
26 -
 27
27 -
 28
28 -
 29
29 -
 30
30 -
 31
31 -
 32
32 -
 33
33 -
 34
34 -
 35
35 -
 36
36 -
 37
37 -
38
-
39
-
40
-
41
-
42
-
43
-
44
-
45
-
46
-
47
-
48
-
49
-
50
-
51
-
52
-
53
-
54
-
55
-
56
-
57
-
58
-
59
-
60
-
61
-
62
-
63
-
64
-
65
-
66
-
67
-
68
 |
 |
[2 of 3]
ANNUAL REPORT 2014
President’s MessagePresident’s Message
Overview of
Four Business Units
Overview of
Four Business Units
Special FeatureSpecial Feature
Review of OperationsReview of Operations
Consolidated Performance
Highlights
Consolidated Performance
Highlights
Management and
Corporate Information
Management and
Corporate Information
Investor InformationInvestor Information
Financial SectionFinancial Section
Page 27
NextPrev
ContentsSearchPrint
1,000
0
200
400
600
800
30,000
0
15,000
5,000
10,000
20,000
25,000
2,500
0
500
1,000
1,500
2,000
10
0
2
4
6
8
2,000
0
1,000
1,500
500
20
0
10
15
5
50
0
10
20
40
30
15,000
0
3,000
6,000
12,000
9,000
0
9,000
3,000
6,000
12,000
15,000
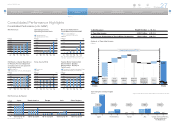
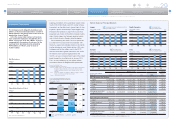
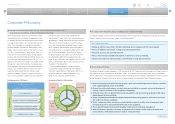
Net Income Attributable to
Toyota Motor Corporation/ROE
Note: “Net Income Attributable to Toyota Motor
Corporation,” equivalent to “Net Income” up to 2009.
Net Income Attributable
to Toyota Motor Corporation
ROE
(¥ Billion) (%)
FY ’10 ’11 ’12 ’13 ’14
Operating Income /
Operating Income Ratio
Operating Income
Operating Income Ratio
(¥ Billion) (%)
FY ’10 ’11 ’12 ’13 ’14
Total Assets/ROA
Total Assets
ROA
(¥ Billion) (%)
FY ’10 ’11 ’12 ’13 ’14
(¥ Billion) (%)
FY ’10 ’11 ’12 ’13 ’14
Toyota Motor Corporation
Shareholders’ Equity/
Shareholders’ Equity to
Total Assets
Toyota Motor Corporation Shareholders’ Equity
Shareholders’ Equity to Total Assets
R&D Expenses/Capital Expenditures
for Property, Plant and Equipment
(excluding vehicles and equipment
on operating leases)
R&D Expenses
Capital Expenditures for Property, Plant and Equipment
(¥ Billion)
FY ’10 ’11 ’12 ’13 ’14
Net Revenues
(¥ Billion)
FY ’10 ’11 ’12 ’13 ’14
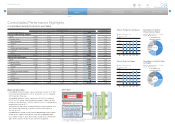
Net Revenues by Region
(¥ Billion)
FY ’10’11’12’13’14
Note: Fiscal years ended March 31
Japan
’10’11’12’13’14
North America
’10’11’12’13’14
Europe
’10’11’12’13’14
Asia
’10’11’12’13’14
Other Regions
50,000
0
10,000
5
0
1
20,000 2
30,000 3
40,000 4
Net Revenues: ¥25,691.9 billion ( +16.4%)
Operating Income 2,292.1 billion (+73.5%)
Net Income Attributable to Toyota Motor Corporation 1,823.1 billion (+89.5%)
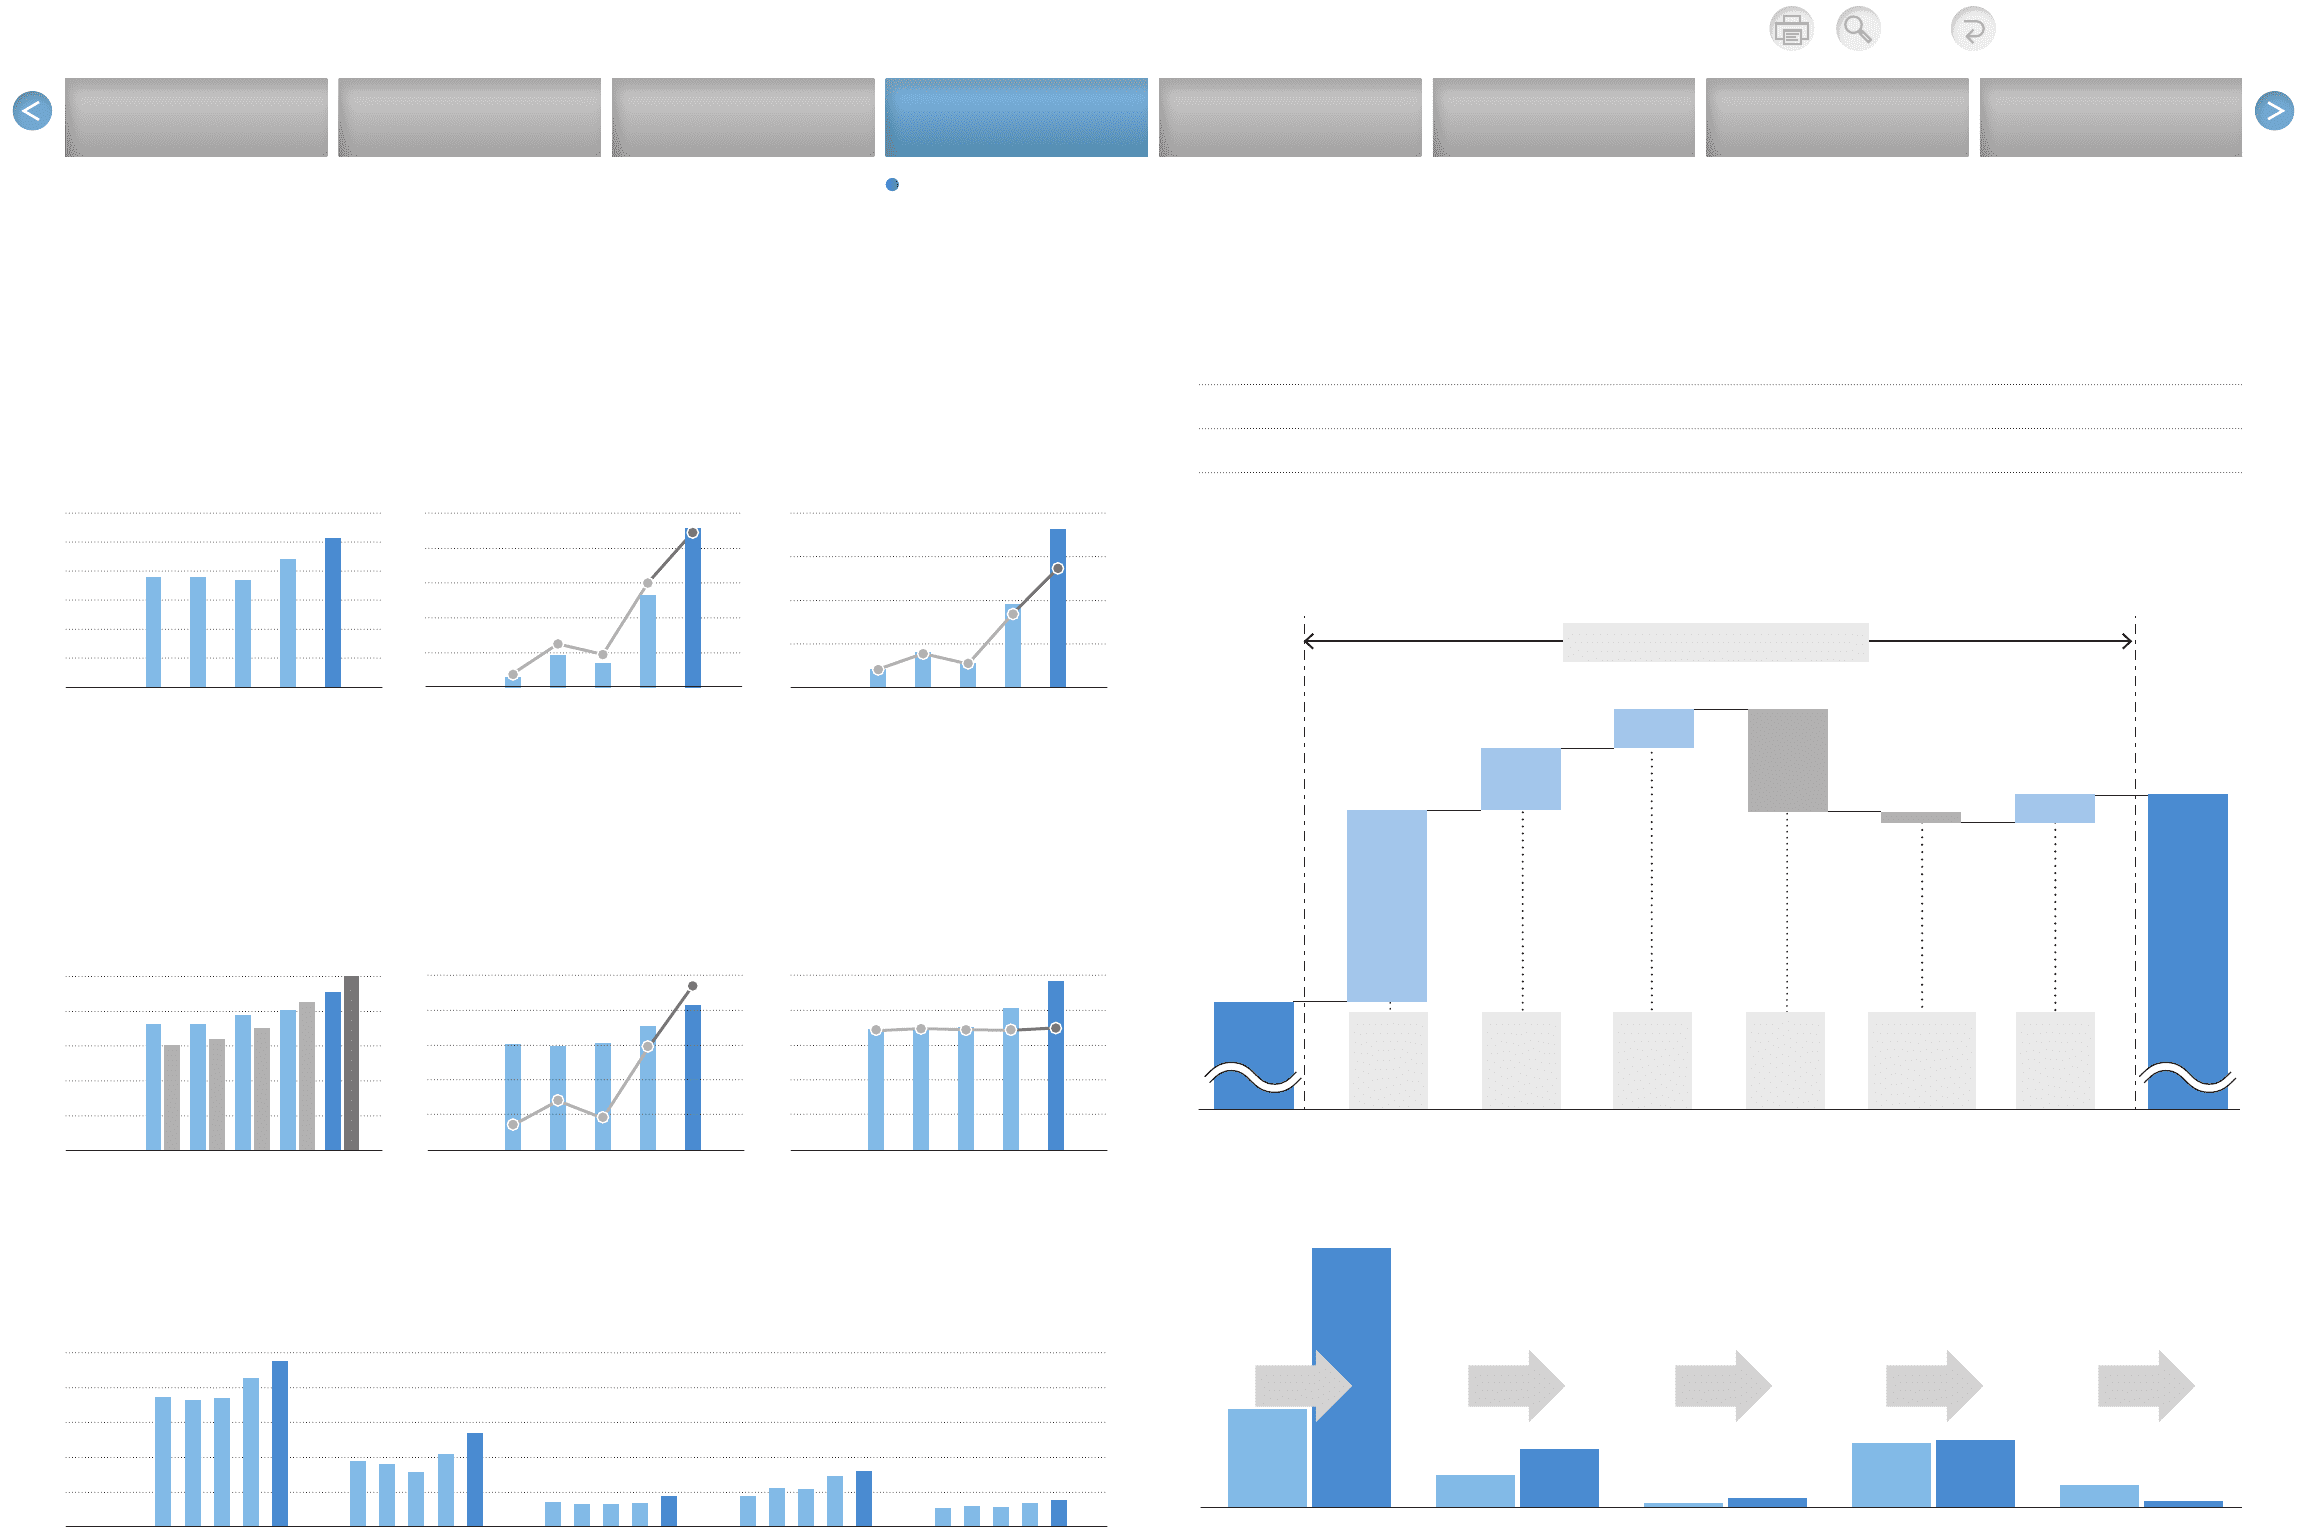
* Figures for North America exclude valuation gains/losses from interest rate swaps.(¥ Billion)
Central and South America,
Oceania, Africa and
The Middle East
AsiaEuropeNorth AmericaJapan
Operating Income by Region
’13 ’14 ’13 ’14 ’13 ’14 ’13 ’14 ’13 ’14
+152.7 +31.7 +19.6 –91.1
1,510.1
576.3
341.5*
188.9* 58.2
26.4
395.7
376.0
42.5
133.7
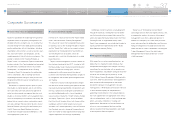
+933.8
0
(¥ Billion)
1,320.8
FY2013 FY2014
Analysis of Operating Income
2,292.1
Operating Income +971.2
Cost
Reduction
Efforts
+290.0
Marketing
Efforts
+180.0
Increase in
Expenses,
etc.
–480.0
Valuation
Gain/Losses
from Interest
Rate Swaps
–51.6
Other
+132.8
Effects of
FOREX
Rates
+900.0
Consolidated Performance Highlights
Consolidated Performance (U.S. GAAP)