Toyota 2014 Annual Report Download - page 52
Download and view the complete annual report
Please find page 52 of the 2014 Toyota annual report below. You can navigate through the pages in the report by either clicking on the pages listed below, or by using the keyword search tool below to find specific information within the annual report.-
 1
1 -
2
-
3
-
4
-
5
-
6
-
7
-
8
-
9
-
10
-
11
-
12
-
13
-
14
-
15
-
16
-
17
-
18
-
19
-
20
-
21
-
22
-
23
-
24
-
25
-
26
-
27
-
28
-
29
-
30
-
31
-
32
-
33
-
34
-
35
-
36
-
37
-
38
-
39
-
40
-
41
-
 42
42 -
 43
43 -
 44
44 -
 45
45 -
 46
46 -
 47
47 -
 48
48 -
 49
49 -
 50
50 -
 51
51 -
 52
52 -
 53
53 -
 54
54 -
 55
55 -
 56
56 -
 57
57 -
 58
58 -
 59
59 -
 60
60 -
 61
61 -
 62
62 -
63
-
64
-
65
-
66
-
67
-
68
 |
 |
ANNUAL REPORT 2014
President’s MessagePresident’s Message
Overview of
Four Business Units
Overview of
Four Business Units
Special FeatureSpecial Feature
Review of OperationsReview of Operations
Consolidated Performance
Highlights
Consolidated Performance
Highlights
Management and
Corporate Information
Management and
Corporate Information
Investor InformationInvestor Information
Financial SectionFinancial Section
Page 52
NextPrev
ContentsSearchPrint
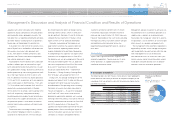
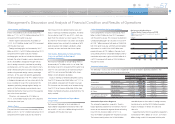
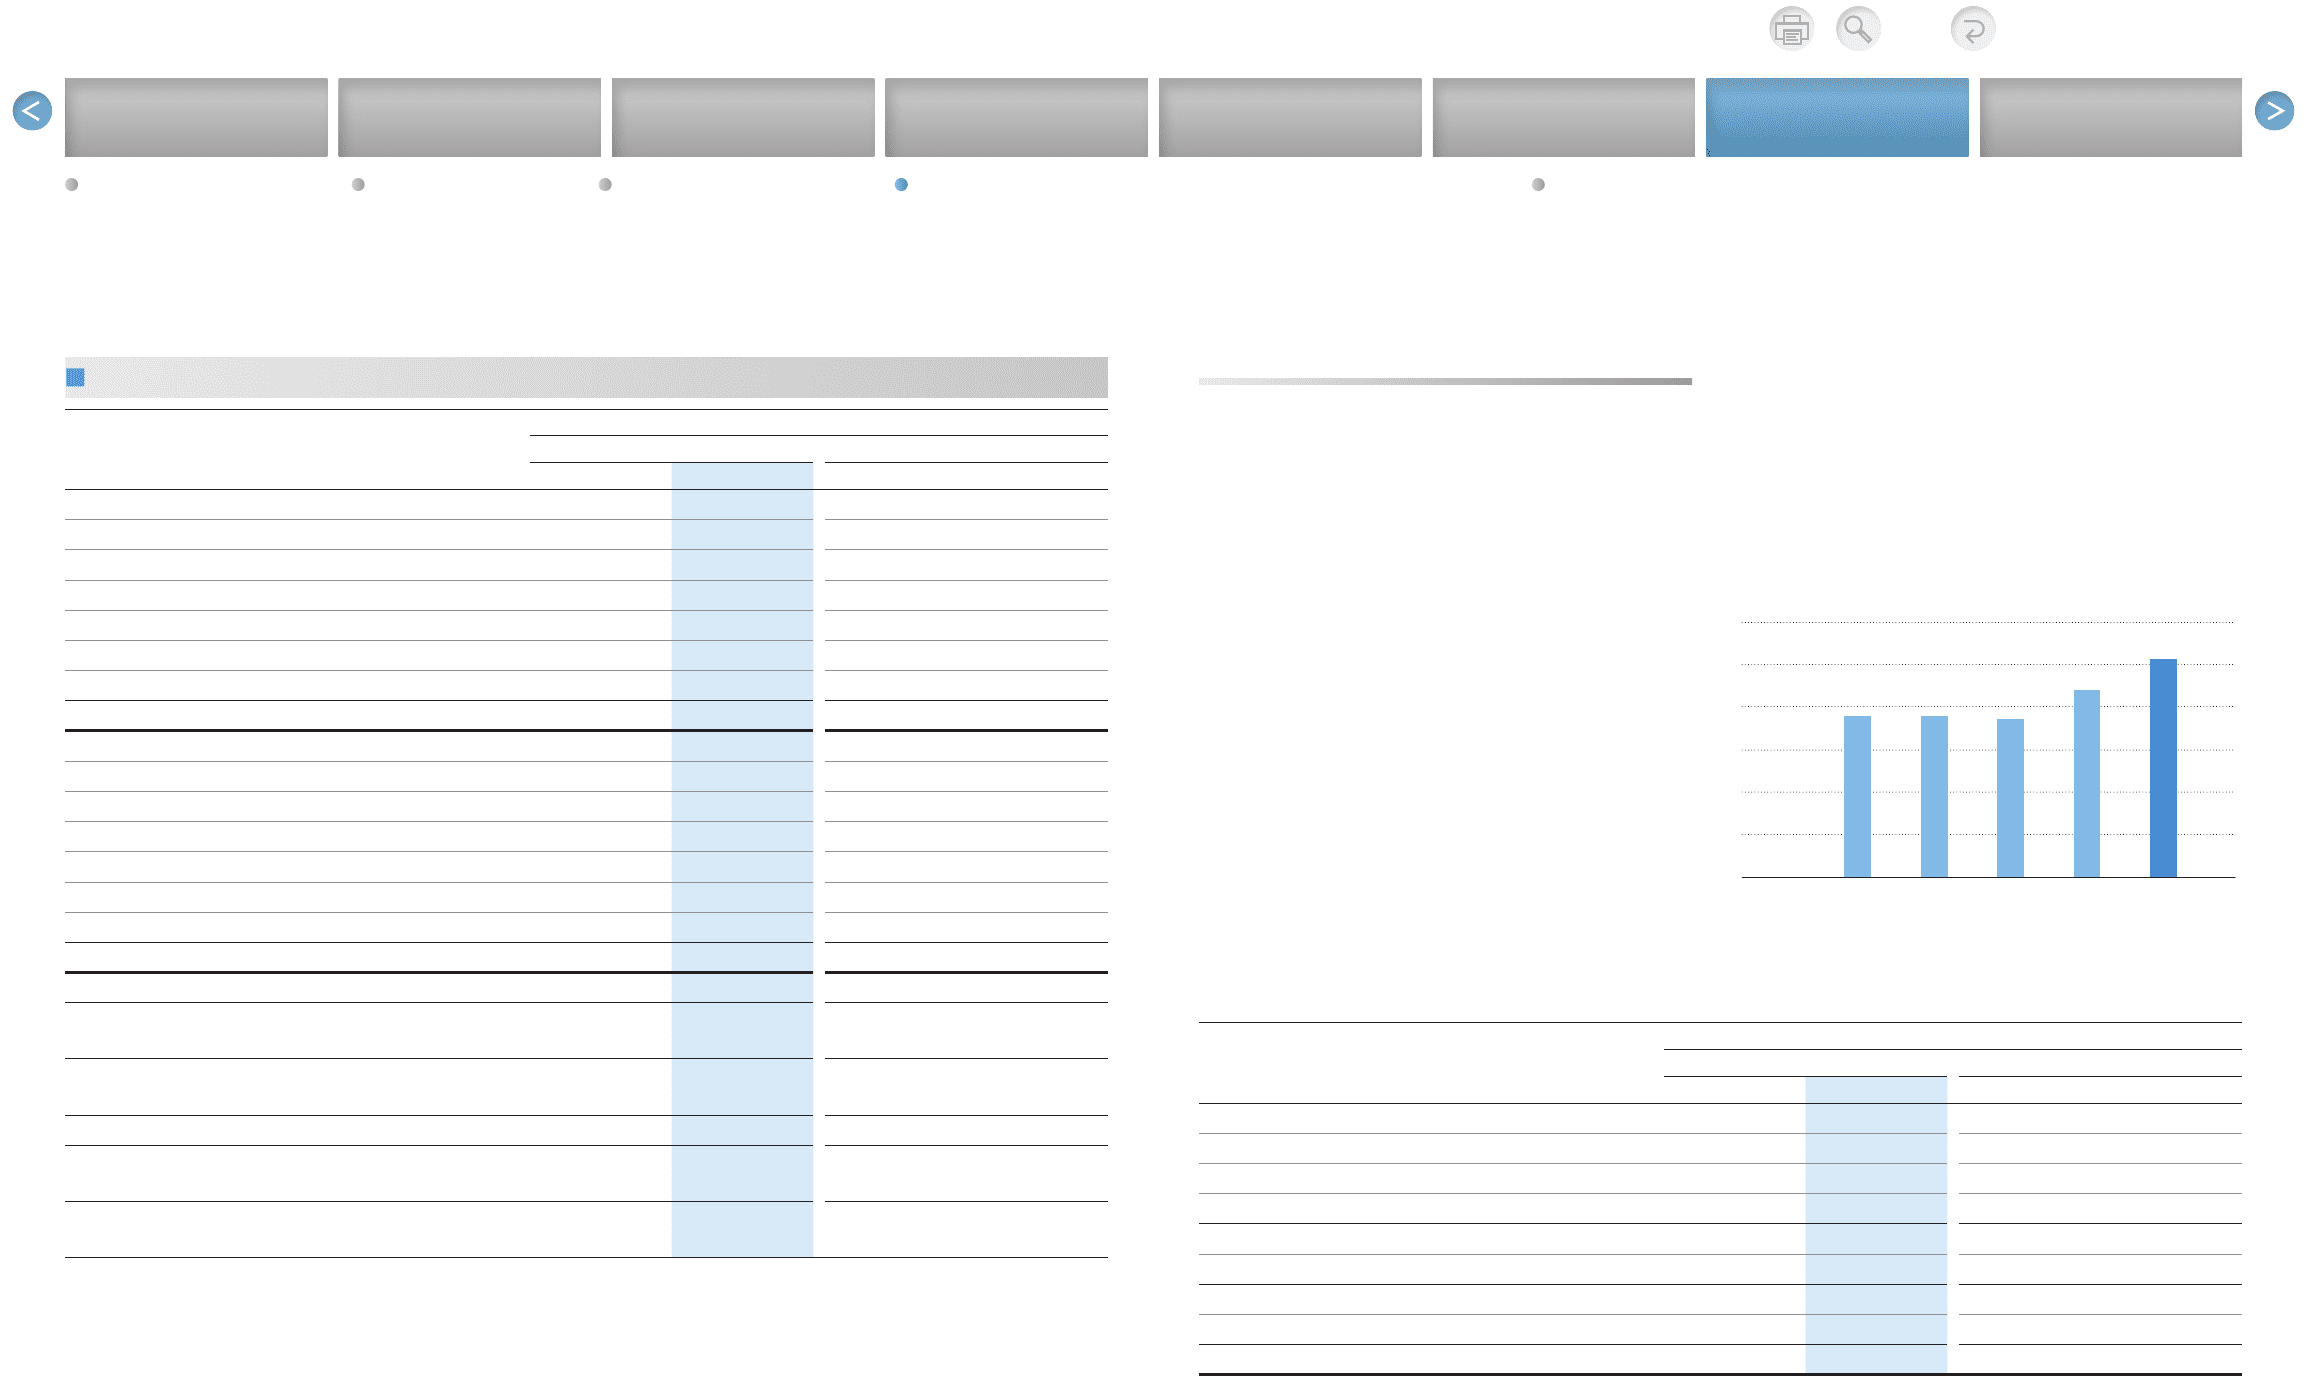
Toyota had net revenues for fiscal 2014 of
¥25,691.9 billion, an increase of ¥3,627.7 billion, or
16.4%, compared with the prior fiscal year. This
increase mainly reflected the favorable impact of
fluctuations in foreign currency translation rates of
¥2,510.4 billion and changes in vehicle unit sales
and sales mix of ¥300.0 billion. Excluding the
impact of changes in the Japanese yen values used
for translation purposes of ¥2,510.4 billion, net rev-
enues would have been ¥23,181.4 billion during fis-
cal 2014, a 5.1% increase compared with the prior
fiscal year. The automotive market in calendar year
2013 increased by 7.9% in North America and in
fiscal 2014 increased by 5.9% in Japan compared
with the prior year due to the market in the U.S. and
Japan progressing in a steady manner. Under these
automotive market conditions, Toyota’s consolidat-
ed vehicle unit sales increased by 2.8% compared
with the prior fiscal year to 9,116 thousand vehicles.
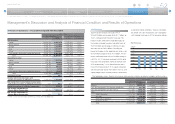
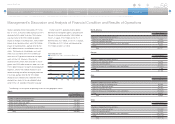
Yen in millions
Years ended March 31, 2014 vs. 2013 Change
2013 2014 Amount Percentage (%)
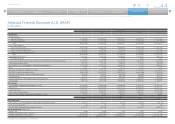
Net revenues:
Japan 12,821,018 14,297,470 1,476,452 +11.5
North America 6,284,425 8,117,099 1,832,674 +29.2
Europe 2,083,113 2,724,959 641,846 +30.8
Asia 4,385,476 4,877,672 492,196 +11.2
Other* 2,094,265 2,336,641 242,376 +11.6
Intersegment elimination/unallocated amount (5,604,105) (6,661,930) (1,057,825) —
Total 22,064,192 25,691,911 3,627,719 +16.4
Operating income:
Japan 576,335 1,510,165 933,830 +162.0
North America 221,925 326,052 104,127 +46.9
Europe 26,462 58,228 31,766 +120.0
Asia 376,055 395,737 19,682 +5.2
Other* 133,744 42,568 (91,176) –68.2
Intersegment elimination/unallocated amount (13,633) (40,638) (27,005) —
Total 1,320,888 2,292,112 971,224 +73.5
Operating margin 6.0% 8.9% 2.9%
Income before income taxes and
equity in earnings of affiliated companies 1,403,649 2,441,080 1,037,431 +73.9
Net margin from income before income taxes
and equity in earnings of affiliated companies 6.4% 9.5% 3.1%
Equity in earnings of affiliated companies 231,519 318,376 86,857 +37.5
Net income attributable to
Toyota Motor Corporation 962,163 1,823,119 860,956 +89.5
Net margin attributable to
Toyota Motor Corporation 4.4% 7.1% 2.7%
* “Other” consists of Central and South America, Oceania, Africa and Middle East.
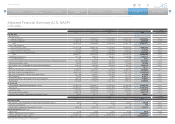
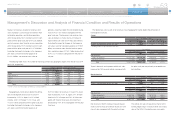
The table below shows Toyota’s net revenues from external customers by product category and by business.
Yen in millions
Years ended March 31, 2014 vs. 2013 Change
2013 2014 Amount Percentage (%)
Vehicles 17,446,473 20,353,340 2,906,867 +16.7
Parts and components for overseas production 356,756 431,760 75,004 +21.0
Parts and components for after service 1,577,690 1,843,478 265,788 +16.8
Other 997,843 1,105,277 107,434 +10.8
Total Automotive 20,378,762 23,733,855 3,355,093 +16.5
All Other 535,388 578,789 43,401 +8.1
Total sales of products 20,914,150 24,312,644 3,398,494 +16.2
Financial services 1,150,042 1,379,267 229,225 +19.9
Total 22,064,192 25,691,911 3,627,719 +16.4
30,000
0
20,000
25,000
15,000
10,000
5,000
FY
Net Revenues
(¥ Billion)
’10 ’11 ’12 ’13 ’14
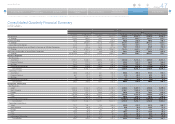
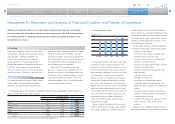
Management’s Discussion and Analysis of Financial Condition and Results of Operations
Selected Financial Summary (U.S. GAAP) Consolidated Segment Information Consolidated Quarterly Financial Summary Management’s Discussion and Analysis of Financial Condition and Results of Operations [5 of 14] Consolidated Financial Statements
Results of Operations — Fiscal 2014 Compared with Fiscal 2013 Net Revenues