Toyota 2014 Annual Report Download - page 60
Download and view the complete annual report
Please find page 60 of the 2014 Toyota annual report below. You can navigate through the pages in the report by either clicking on the pages listed below, or by using the keyword search tool below to find specific information within the annual report.-
 1
1 -
2
-
3
-
4
-
5
-
6
-
7
-
8
-
9
-
10
-
11
-
12
-
13
-
14
-
15
-
16
-
17
-
18
-
19
-
20
-
21
-
22
-
23
-
24
-
25
-
26
-
27
-
28
-
29
-
30
-
31
-
32
-
33
-
34
-
35
-
36
-
37
-
38
-
39
-
40
-
41
-
42
-
43
-
44
-
45
-
46
-
47
-
48
-
49
-
 50
50 -
 51
51 -
 52
52 -
 53
53 -
 54
54 -
 55
55 -
 56
56 -
 57
57 -
 58
58 -
 59
59 -
 60
60 -
 61
61 -
 62
62 -
 63
63 -
 64
64 -
 65
65 -
 66
66 -
 67
67 -
 68
68
 |
 |

ANNUAL REPORT 2014
President’s MessagePresident’s Message
Overview of
Four Business Units
Overview of
Four Business Units
Special FeatureSpecial Feature
Review of OperationsReview of Operations
Consolidated Performance
Highlights
Consolidated Performance
Highlights
Management and
Corporate Information
Management and
Corporate Information
Investor InformationInvestor Information
Financial SectionFinancial Section
Page 60
NextPrev
ContentsSearchPrint
the Company — Business Overview — Governmental
Regulation, Environmental and Safety Standards” in
Toyota’s annual report on Form 20-F.
Cash and cash equivalents were ¥2,041.1 billion
as of March 31, 2014. Most of Toyota’s cash and
cash equivalents are held in Japanese yen or in
U.S. dollars. In addition, time deposits were ¥180.2
billion and marketable securities were ¥2,046.8 bil-
lion as of March 31, 2014.
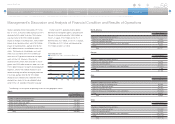
Liquid assets, which Toyota defines as cash and
cash equivalents, time deposits, marketable debt
securities and its investment in monetary trust
funds, increased during fiscal 2014 by ¥1,954.5 bil-
lion, or 28.7%, to ¥8,759.0 billion.
Trade accounts and notes receivable, less allow-
ance for doubtful accounts increased during fiscal
2014 by ¥64.5 billion, or 3.3%, to ¥2,036.2 billion.
This increase was due mainly to the fluctuations in
foreign currency translation rates.
Inventories increased during fiscal 2014 by
¥178.9 billion, or 10.4%, to ¥1,894.7 billion. This
increase was due mainly to the fluctuations in
foreign currency translation rates.
Total finance receivables, net increased during
fiscal 2014 by ¥1,669.8 billion, or 13.8%, to
¥13,731.2 billion. This increase was due mainly to
the fluctuations in foreign currency translation rates
and an increase in the number of financing con-
tracts. As of March 31, 2014, finance receivables
were geographically distributed as follows: in North
America 57.1%, in Asia 11.4%, in Europe 10.8%, in
Japan 8.9% and in Other 11.8%.
Marketable securities and other securities invest-
ments, including those included in current assets,
increased during fiscal 2014 by ¥2,189.6 billion, or
33.1%, reflecting an increase in the fair values of
Management’s Discussion and Analysis of Financial Condition and Results of Operations
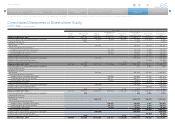
Selected Financial Summary (U.S. GAAP) Consolidated Segment Information Consolidated Quarterly Financial Summary Management’s Discussion and Analysis of Financial Condition and Results of Operations [13 of 14] Consolidated Financial Statements
10,000
0
8,000
4,000
6,000
2,000
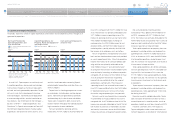
Liquid Assets*
(¥ Billion)
FY ’10 ’11 ’12 ’13 ’14
* Cash and cash equivalents, time deposits, marketable debt securities and
investment in monetary trust funds
15,000
0
60
10,000 40
12,500 50
7,500 30
2,500 10
5,000 20
0
Shareholders’ Equity and Equity Ratio
Shareholders’ equity Equity ratio (Right scale)
(¥ Billion)
FY
(%)
’10 ’11 ’12 ’13 ’14
common stocks and purchase of marketable secu-
rities and security investments.
Property, plant and equipment increased during
fiscal 2014 by ¥790.0 billion, or 11.5%, primarily
reflecting fluctuations in foreign currency translation
rates and the increase in the capital expenditures,
partially offset by the impacts of depreciation charg-
es during the year.
Accounts and notes payable increased during
fiscal 2014 by ¥99.4 billion, or 4.7%. This increase
was due mainly to the increase in production vol-
ume in the fourth quarter of fiscal 2014.
Accrued expenses increased during fiscal 2014
by ¥127.6 billion, or 5.8%. This increase was due
mainly to the increase in product quality related
expenses.
Income taxes payable increased during fiscal
2014 by ¥438.5 billion, or 280.7%. This increase
was due mainly to the increase in income before
income taxes and equity in earnings of affiliated
companies.
Toyota’s total borrowings increased during fiscal
2014 by ¥2,195.6 billion, or 15.5%. Toyota’s short-
term borrowings consist of loans with a weighted-
average interest rate of 2.57% and commercial
paper with a weighted-average interest rate of
0.49%. Short-term borrowings increased during fis-
cal 2014 by ¥741.2 billion, or 18.1%, to ¥4,830.8
billion. Toyota’s long-term debt consists of unse-
cured and secured loans, medium-term notes,
unsecured notes and long-term capital lease obliga-
tions with interest rates ranging from 0.00% to
41.79%, and maturity dates ranging from 2014 to
2047. The current portion of long-term debt
increased during fiscal 2014 by ¥245.2 billion, or
9.1%, to ¥2,949.6 billion and the non-current por-
tion increased by ¥1,209.0 billion, or 16.5%, to
¥8,546.9 billion. The increase in total borrowings
resulted mainly from an increase in medium-term
notes. As of March 31, 2014, approximately 43% of
long-term debt was denominated in U.S. dollars,
14% in Japanese yen, 11% in Australian dollars,
and 32% in other currencies. Toyota hedges interest
rate risk exposure of fixed-rate borrowings by enter-
ing into interest rate swaps. There are no material
seasonal variations in Toyota’s borrowings
requirements.
As of March 31, 2014, Toyota’s total interest
bearing debt was 112.8% of Toyota Motor
Corporation shareholders’ equity, compared with
116.3% as of March 31, 2013.
The following table provides information for credit
rating of Toyota’s short-term borrowing and long-
term debt from rating agencies, Standard & Poor’s
Ratings Group (S&P), Moody’s Investors Services
(Moody’s), and Rating and Investment Information,
Inc. (R&I), as of May 31, 2014. A credit rating is not
a recommendation to buy, sell or hold securities. A
credit rating may be subject to withdrawal or revi-
sion at any time. Each rating should be evaluated
separately of any other rating.
S&P Moody’s R&I
Short-term borrowing A-1+ P-1 —
Long-term debt AA- Aa3 AA+