Toyota 2014 Annual Report Download - page 56
Download and view the complete annual report
Please find page 56 of the 2014 Toyota annual report below. You can navigate through the pages in the report by either clicking on the pages listed below, or by using the keyword search tool below to find specific information within the annual report.-
 1
1 -
2
-
3
-
4
-
5
-
6
-
7
-
8
-
9
-
10
-
11
-
12
-
13
-
14
-
15
-
16
-
17
-
18
-
19
-
20
-
21
-
22
-
23
-
24
-
25
-
26
-
27
-
28
-
29
-
30
-
31
-
32
-
33
-
34
-
35
-
36
-
37
-
38
-
39
-
40
-
41
-
42
-
43
-
44
-
45
-
 46
46 -
 47
47 -
 48
48 -
 49
49 -
 50
50 -
 51
51 -
 52
52 -
 53
53 -
 54
54 -
 55
55 -
 56
56 -
 57
57 -
 58
58 -
 59
59 -
 60
60 -
 61
61 -
 62
62 -
 63
63 -
 64
64 -
 65
65 -
 66
66 -
67
-
68
 |
 |

ANNUAL REPORT 2014
President’s MessagePresident’s Message
Overview of
Four Business Units
Overview of
Four Business Units
Special FeatureSpecial Feature
Review of OperationsReview of Operations
Consolidated Performance
Highlights
Consolidated Performance
Highlights
Management and
Corporate Information
Management and
Corporate Information
Investor InformationInvestor Information
Financial SectionFinancial Section
Page 56
NextPrev
ContentsSearchPrint
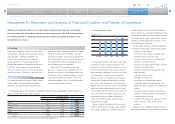
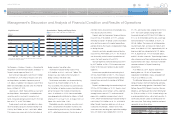
Toyota’s operating income increased by ¥971.2 bil-
lion, or 73.5%, to ¥2,292.1 billion during fiscal 2014
compared with the prior fiscal year. This increase
was due mainly to the ¥900.0 billion favorable
impact of changes in exchange rates, ¥290.0 billion
impact of cost reduction efforts, and ¥180.0 billion
impact of marketing efforts, partially offset by the
¥480.0 billion increase in miscellaneous costs and
others. The increase in miscellaneous costs and
others was due mainly to the ¥125.0 billion pay-
ment to the U.S. government based on the agree-
ment with the U.S. Attorney’s Office for the
Southern District of New York to resolve its investi-
gation, the ¥100.0 billion increase in labor costs, the
¥100.0 billion increase in research and development
expenses, and the ¥83.0 billion increase in costs
related to ending the vehicle and engine production
in Australia, partially offset by the ¥90.0 billion
charge for costs related to the settlement of the
economic loss claims in the consolidated federal
action in the U.S. recorded in the prior fiscal year.
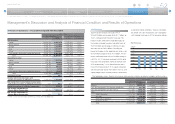
During fiscal 2014, operating income (before
elimination of intersegment profits), compared with
the prior fiscal year increased by ¥933.8 billion, or
162.0%, in Japan, ¥104.1 billion, or 46.9%, in
North America, ¥31.7 billion, or 120.0%, in Europe,
¥19.6 billion, or 5.2%, in Asia, and decreased by
¥91.1 billion, or 68.2%, in Other.
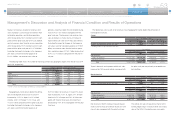
North America
Yen in millions
2014 vs. 2013 Change
Changes in operating income and loss:
Effect of cost reduction efforts 75,000
Effect of marketing activities (25,000)
Effect of decrease of miscellaneous costs and others 50,000
Other 4,127
Total 104,127
Europe
Yen in millions
2014 vs. 2013 Change
Changes in operating income and loss:
Effect of cost reduction efforts 15,000
Effect of marketing efforts 25,000
Effect of increase of miscellaneous costs and others (10,000)
Other 1,766
Total 31,766
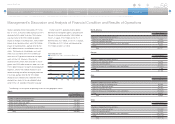
Asia
Yen in millions
2014 vs. 2013 Change
Changes in operating income and loss:
Effect of changes in exchange rates 25,000
Effect of cost reduction efforts 35,000
Effect of marketing activities (40,000)
Effect of increase of miscellaneous costs and others (50,000)
Other 49,682
Total 19,682
Other
Yen in millions
2014 vs. 2013 Change
Changes in operating income and loss:
Effect of cost reduction efforts (10,000)
Effect of marketing efforts 40,000
Effect of increase of miscellaneous costs and others (100,000)
Other (21,176)
Total (91,176)
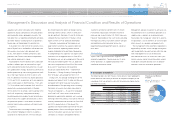
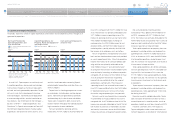
2,500
2,000
500
1,000
1,500
Operating Income
Operating income % of net revenues (Right scale)
(¥ Billion)
FY
(%)
0
10
8
2
4
6
0
’10 ’11 ’12 ’13 ’14
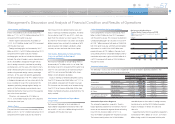
The following is a description of operating income in each geographic market.
Japan
Yen in millions
2014 vs. 2013 Change
Changes in operating income and loss:
Effect of changes in exchange rates 940,000
Effect of cost reduction efforts 175,000
Effect of marketing efforts 180,000
Effect of increase of miscellaneous costs and others (370,000)
Other 8,830
Total 933,830
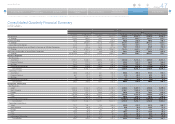
Management’s Discussion and Analysis of Financial Condition and Results of Operations
Selected Financial Summary (U.S. GAAP) Consolidated Segment Information Consolidated Quarterly Financial Summary Management’s Discussion and Analysis of Financial Condition and Results of Operations [9 of 14] Consolidated Financial Statements