Toyota 2014 Annual Report Download - page 47
Download and view the complete annual report
Please find page 47 of the 2014 Toyota annual report below. You can navigate through the pages in the report by either clicking on the pages listed below, or by using the keyword search tool below to find specific information within the annual report.-
 1
1 -
2
-
3
-
4
-
5
-
6
-
7
-
8
-
9
-
10
-
11
-
12
-
13
-
14
-
15
-
16
-
17
-
18
-
19
-
20
-
21
-
22
-
23
-
24
-
25
-
26
-
27
-
28
-
29
-
30
-
31
-
32
-
33
-
34
-
35
-
36
-
 37
37 -
 38
38 -
 39
39 -
 40
40 -
 41
41 -
 42
42 -
 43
43 -
 44
44 -
 45
45 -
 46
46 -
 47
47 -
 48
48 -
 49
49 -
 50
50 -
 51
51 -
 52
52 -
 53
53 -
 54
54 -
 55
55 -
 56
56 -
 57
57 -
58
-
59
-
60
-
61
-
62
-
63
-
64
-
65
-
66
-
67
-
68
 |
 |
ANNUAL REPORT 2014
President’s MessagePresident’s Message
Overview of
Four Business Units
Overview of
Four Business Units
Special FeatureSpecial Feature
Review of OperationsReview of Operations
Consolidated Performance
Highlights
Consolidated Performance
Highlights
Management and
Corporate Information
Management and
Corporate Information
Investor InformationInvestor Information
Financial SectionFinancial Section
Page 47
NextPrev
ContentsSearchPrint
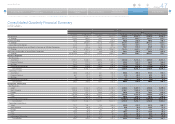
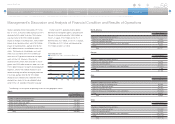
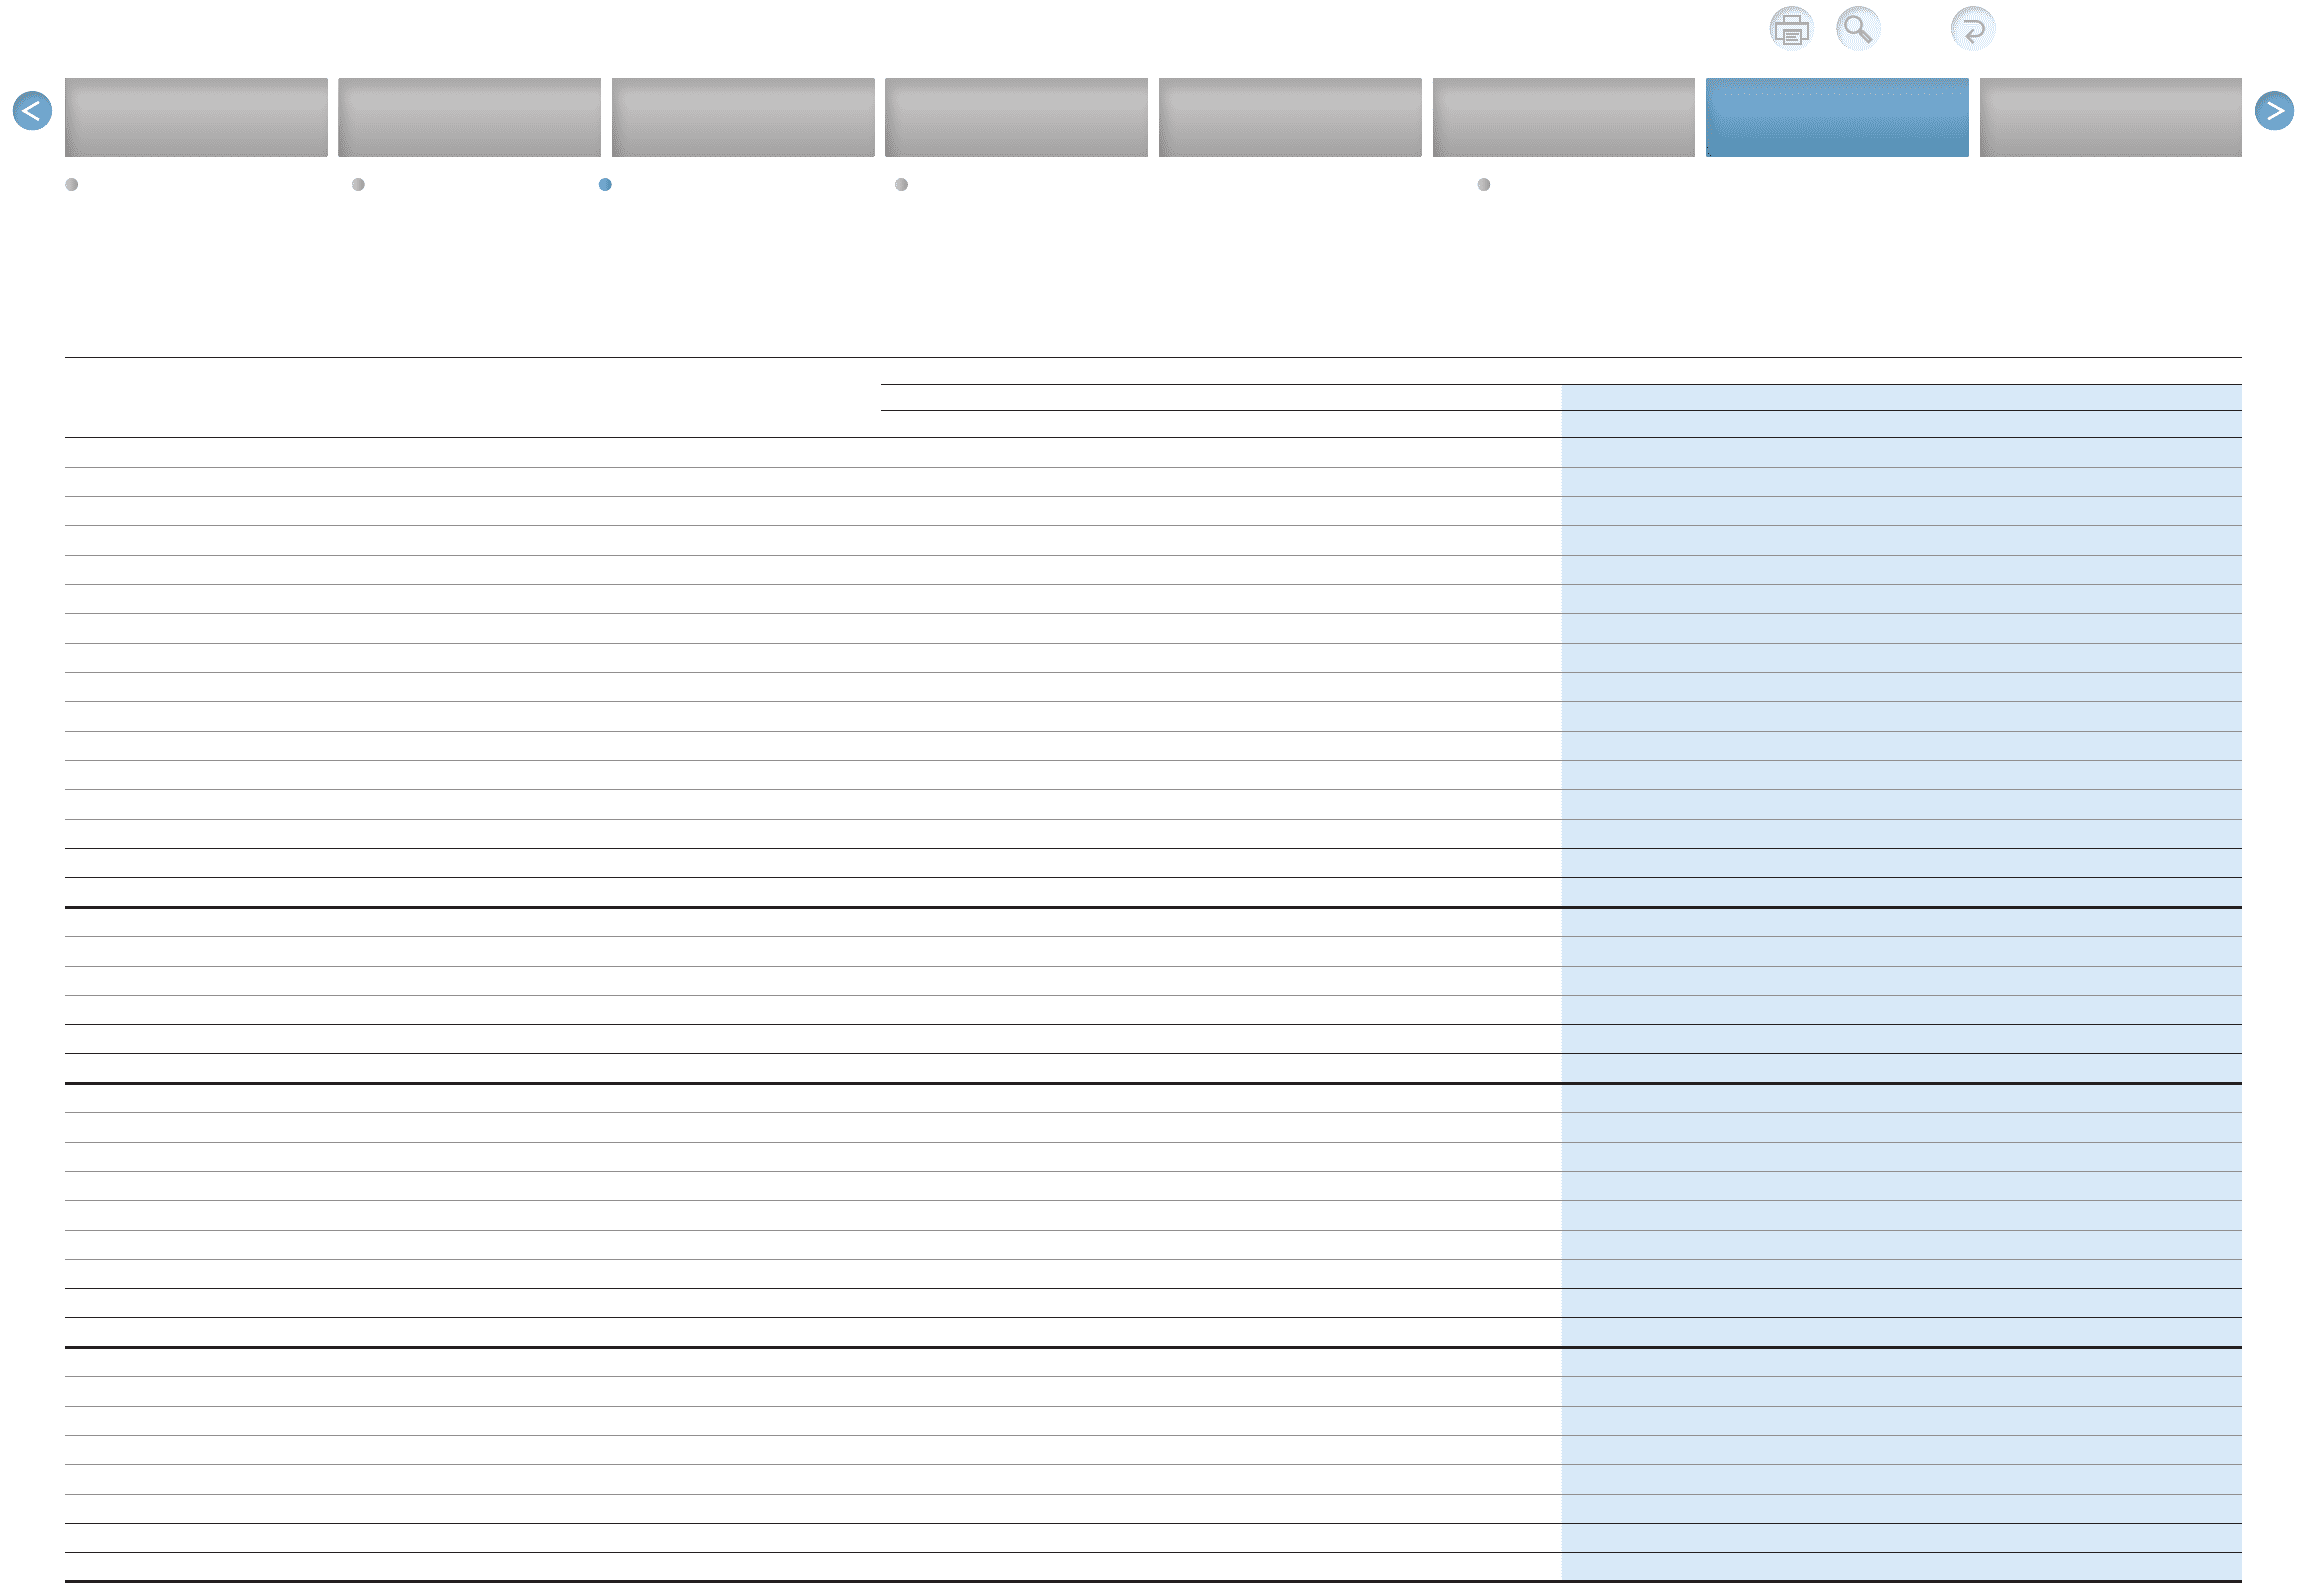
Yen in billions
2013 2014
First Quarter Second Quarter Third Quarter Fourth Quarter First Quarter Second Quarter Third Quarter Fourth Quarter
Net Revenues 5,501.5 5,406.7 5,318.7 5,837.0 6,255.3 6,282.1 6,585.0 6,569.3
% Change 59.9% 18.2% 9.3% 2.4% 13.7% 16.2% 23.8% 12.5%
Operating Income 353.1 340.6 124.7 502.3 663.3 592.0 600.5 436.1
% Change —% 351.8% –16.7% 110.6% 87.9% 73.8% 381.6% –13.2%
Operating Income Margin 6.4% 6.3% 2.3% 8.6% 10.6% 9.4% 9.1% 6.6%
Income before Income Taxes and Equity in Earnings of Affiliated Companies 415.2 379.3 131.2 477.8 724.1 619.3 678.9 418.5
% Change —% 379.4% –33.9% 102.8% 74.4% 63.3% 417.5% –12.4%
Net Income Attributable to Toyota Motor Corporation 290.3 257.9 99.9 313.9 562.1 438.4 525.4 297.0
% Change 24,929.9% 220.7% 23.4% 159.4% 93.6% 70.0% 425.9% –5.4%
Business Segment:
Net Revenues:
Automotive 5,120.1 5,008.7 4,889.2 5,401.0 5,818.0 5,815.2 6,096.5 6,051.5
Financial Services 274.4 272.0 301.3 322.8 339.8 347.7 364.9 368.5
All Other 243.2 252.6 262.0 308.4 234.4 273.5 278.4 364.8
Intersegment Elimination (136.2) (126.6) (133.8) (195.2) (137.0) (154.4) (154.8) (215.4)
Consolidated 5,501.5 5,406.7 5,318.7 5,837.0 6,255.3 6,282.1 6,585.0 6,569.3
Operating Income:
Automotive 258.6 239.3 43.7 402.9 608.4 499.5 515.5 315.1
Financial Services 86.7 87.7 69.0 72.2 51.2 82.0 67.3 94.2
All Other 9.3 13.1 15.4 15.7 7.1 13.1 20.6 23.2
Intersegment Elimination (1.6) 0.3 (3.4) 11.4 (3.5) (2.6) (3.0) 3.3
Consolidated 353.1 340.6 124.7 502.3 663.3 592.0 600.5 436.1
Geographic Information:
Net Revenues:
Japan 3,242.2 3,163.9 2,976.2 3,438.5 3,456.2 3,487.5 3,544.0 3,809.6
North America 1,592.8 1,450.9 1,525.0 1,715.6 2,105.1 1,962.8 2,136.8 1,912.2
Europe 512.0 497.5 508.3 565.1 595.9 707.0 726.2 695.6
Asia 1,073.6 1,088.2 1,112.5 1,110.9 1,218.0 1,181.8 1,252.6 1,225.1
Other 483.4 500.8 530.3 579.5 609.0 583.1 603.4 540.9
Intersegment Elimination (1,402.7) (1,294.8) (1,333.8) (1,572.7) (1,729.1) (1,640.2) (1,678.2) (1,614.3)
Consolidated 5,501.5 5,406.7 5,318.7 5,837.0 6,255.3 6,282.1 6,585.0 6,569.3
Operating Income (Loss):
Japan 107.1 143.7 15.6 309.8 456.0 373.9 331.3 348.7
North America 117.6 64.9 (17.1) 56.4 82.6 79.6 112.5 51.2
Europe 3.4 8.6 9.2 5.1 5.2 20.1 17.7 15.1
Asia 101.5 92.9 91.7 89.7 104.1 91.4 110.0 90.0
Other 27.1 31.5 32.3 42.6 42.5 33.6 32.2 (65.7)
Intersegment Elimination (3.7) (1.2) (7.1) (1.4) (27.3) (6.7) (3.4) (3.1)
Consolidated 353.1 340.6 124.7 502.3 663.3 592.0 600.5 436.1
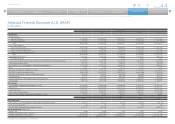
Consolidated Quarterly Financial Summary
Toyota Motor Corporation
Fiscal years ended March 31
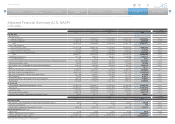
Selected Financial Summary (U.S. GAAP) Consolidated Segment Information Consolidated Quarterly Financial Summary Management’s Discussion and Analysis of Financial Condition and Results of Operations Consolidated Financial Statements