Toyota 2014 Annual Report Download - page 51
Download and view the complete annual report
Please find page 51 of the 2014 Toyota annual report below. You can navigate through the pages in the report by either clicking on the pages listed below, or by using the keyword search tool below to find specific information within the annual report.-
 1
1 -
2
-
3
-
4
-
5
-
6
-
7
-
8
-
9
-
10
-
11
-
12
-
13
-
14
-
15
-
16
-
17
-
18
-
19
-
20
-
21
-
22
-
23
-
24
-
25
-
26
-
27
-
28
-
29
-
30
-
31
-
32
-
33
-
34
-
35
-
36
-
37
-
38
-
39
-
40
-
 41
41 -
 42
42 -
 43
43 -
 44
44 -
 45
45 -
 46
46 -
 47
47 -
 48
48 -
 49
49 -
 50
50 -
 51
51 -
 52
52 -
 53
53 -
 54
54 -
 55
55 -
 56
56 -
 57
57 -
 58
58 -
 59
59 -
 60
60 -
 61
61 -
62
-
63
-
64
-
65
-
66
-
67
-
68
 |
 |

ANNUAL REPORT 2014
President’s MessagePresident’s Message
Overview of
Four Business Units
Overview of
Four Business Units
Special FeatureSpecial Feature
Review of OperationsReview of Operations
Consolidated Performance
Highlights
Consolidated Performance
Highlights
Management and
Corporate Information
Management and
Corporate Information
Investor InformationInvestor Information
Financial SectionFinancial Section
Page 51
NextPrev
ContentsSearchPrint
Japanese yen can be substantial, and, therefore,
significantly impact comparisons with prior periods
and among the various geographic markets, the
translation risk is a reporting consideration and does
not reflect Toyota’s underlying results of operations.
Toyota does not hedge against translation risk.
Transaction risk is the risk that the currency struc-
ture of Toyota’s costs and liabilities will deviate from
the currency structure of sales proceeds and
assets. Transaction risk relates primarily to sales
proceeds from Toyota’s non-domestic operations
from vehicles produced in Japan.
Toyota believes that the location of its production
facilities in different parts of the world has signifi-
cantly reduced the level of transaction risk. As part
of its globalization strategy, Toyota has continued to
localize production by constructing production facili-
ties in the major markets in which it sells its vehi-
cles. In calendar 2012 and 2013, Toyota produced
75.4% and 76.3%, respectively, of its non-domestic
sales outside Japan. In North America, 75.3% and
73.7% of vehicles sold in calendar 2012 and 2013,
respectively, were produced locally. In Europe,
58.5% and 69.4% of vehicles sold in calendar 2012
and 2013, respectively, were produced locally.
Localizing production enables Toyota to locally pur-
chase many of the supplies and resources used in
the production process, which allows for a better
match of local currency revenues with local curren-
cy expenses.
Toyota also enters into foreign currency transac-
tions and other hedging instruments to address
a portion of its transaction risk. This has reduced,
statements and do not conform with U.S. GAAP.
Furthermore, Toyota does not believe that these
measures are a substitute for U.S. GAAP measures.
However, Toyota believes that such results excluding
the impact of currency fluctuations year-on-year pro-
vide additional useful information to investors
regarding the operating performance on a local cur-
rency basis.
Toyota’s most significant business segment is its
automotive operations. Toyota carries out its auto-
motive operations as a global competitor in the
worldwide automotive market.
but not eliminated, the effects of foreign currency
exchange rate fluctuations, which in some years
can be significant. See notes 20 and 26 to the con-
solidated financial statements in Toyota’s annual
report on Form 20-F for additional information.
Generally, a weakening of the Japanese yen
against other currencies has a positive effect on
Toyota’s revenues, operating income and net
income attributable to Toyota Motor Corporation.
A strengthening of the Japanese yen against other
currencies has the opposite effect. In fiscal 2014,
the Japanese yen was on average and at the end of
the fiscal year weaker against the U.S. dollar and
the euro in comparison to fiscal 2013. See further
discussion in “Quantitative and Qualitative
Disclosures about Market Risk — Market Risk
Disclosures — Foreign Currency Exchange Rate
Risk” in Toyota’s annual report on Form 20-F.
During 2014, the average exchange rate of the
Japanese yen against the U.S. dollar and the euro
compared to the prior fiscal year fluctuated as
described above. The operating results excluding
the impact of currency fluctuations described in
“Results of Operations — Fiscal 2014 Compared
with Fiscal 2013” show results of net revenues
obtained by applying the Japanese yen’s average
exchange rate in the previous fiscal year to the local
currency-denominated net revenues for fiscal 2013
and 2014, respectively, as if the value of the
Japanese yen had remained constant for the com-
parable periods. Results excluding the impact of
currency fluctuations year-on-year are not on the
same basis as Toyota’s consolidated financial
Management allocates resources to, and assesses
the performance of, its automotive operations as a
single business segment on a worldwide basis.
Toyota does not manage any subset of its automo-
tive operations, such as domestic or overseas oper-
ations or parts, as separate management units.
The management of the automotive operations is
organized by function, with a manager having over-
sight responsibility for each function within the seg-
ment. Management assesses financial and
non-financial data such as vehicle unit sales, pro-
duction volume, market share information, vehicle
model plans and plant location costs to allocate
resources within the automotive operations.
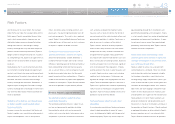
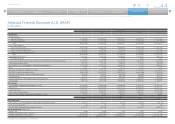
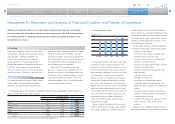
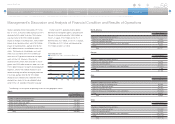
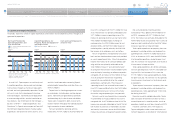
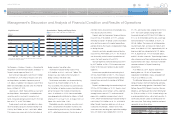
The following table sets forth Toyota’s net revenues in each geographic
market based on the country of location of the parent company or the
subsidiaries that transacted the sale with the external customer for the
past three fiscal years.
Yen in millions
Years Ended March 31,
2012 2013 2014
Japan 7,293,804 7,910,456 8,532,875
North America 4,644,348 6,167,821 7,938,615
Europe 1,917,408 2,003,113 2,614,070
Asia 3,116,849 4,058,629 4,475,382
Other* 1,611,244 1,924,173 2,130,969
* “Other” consists of Central and South America, Oceania, Africa and the Middle East.
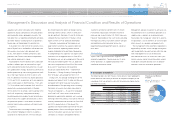
Management’s Discussion and Analysis of Financial Condition and Results of Operations
Japan North America Europe
Asia All Other Markets
Revenues by Market
FY2014
33.2%
30.9%
10.2%
17.4%
8.3%
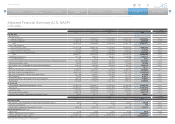
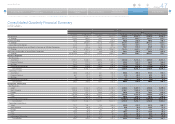
Selected Financial Summary (U.S. GAAP) Consolidated Segment Information Consolidated Quarterly Financial Summary Management’s Discussion and Analysis of Financial Condition and Results of Operations [4 of 14] Consolidated Financial Statements
Geographic Breakdown
Segmentation