Toyota 2014 Annual Report Download - page 63
Download and view the complete annual report
Please find page 63 of the 2014 Toyota annual report below. You can navigate through the pages in the report by either clicking on the pages listed below, or by using the keyword search tool below to find specific information within the annual report.-
 1
1 -
2
-
3
-
4
-
5
-
6
-
7
-
8
-
9
-
10
-
11
-
12
-
13
-
14
-
15
-
16
-
17
-
18
-
19
-
20
-
21
-
22
-
23
-
24
-
25
-
26
-
27
-
28
-
29
-
30
-
31
-
32
-
33
-
34
-
35
-
36
-
37
-
38
-
39
-
40
-
41
-
42
-
43
-
44
-
45
-
46
-
47
-
48
-
49
-
50
-
51
-
52
-
 53
53 -
 54
54 -
 55
55 -
 56
56 -
 57
57 -
 58
58 -
 59
59 -
 60
60 -
 61
61 -
 62
62 -
 63
63 -
 64
64 -
 65
65 -
 66
66 -
 67
67 -
 68
68
 |
 |
ANNUAL REPORT 2014
President’s MessagePresident’s Message
Overview of
Four Business Units
Overview of
Four Business Units
Special FeatureSpecial Feature
Review of OperationsReview of Operations
Consolidated Performance
Highlights
Consolidated Performance
Highlights
Management and
Corporate Information
Management and
Corporate Information
Investor InformationInvestor Information
Financial SectionFinancial Section
Page 63
NextPrev
ContentsSearchPrint
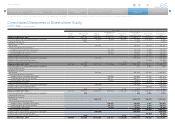
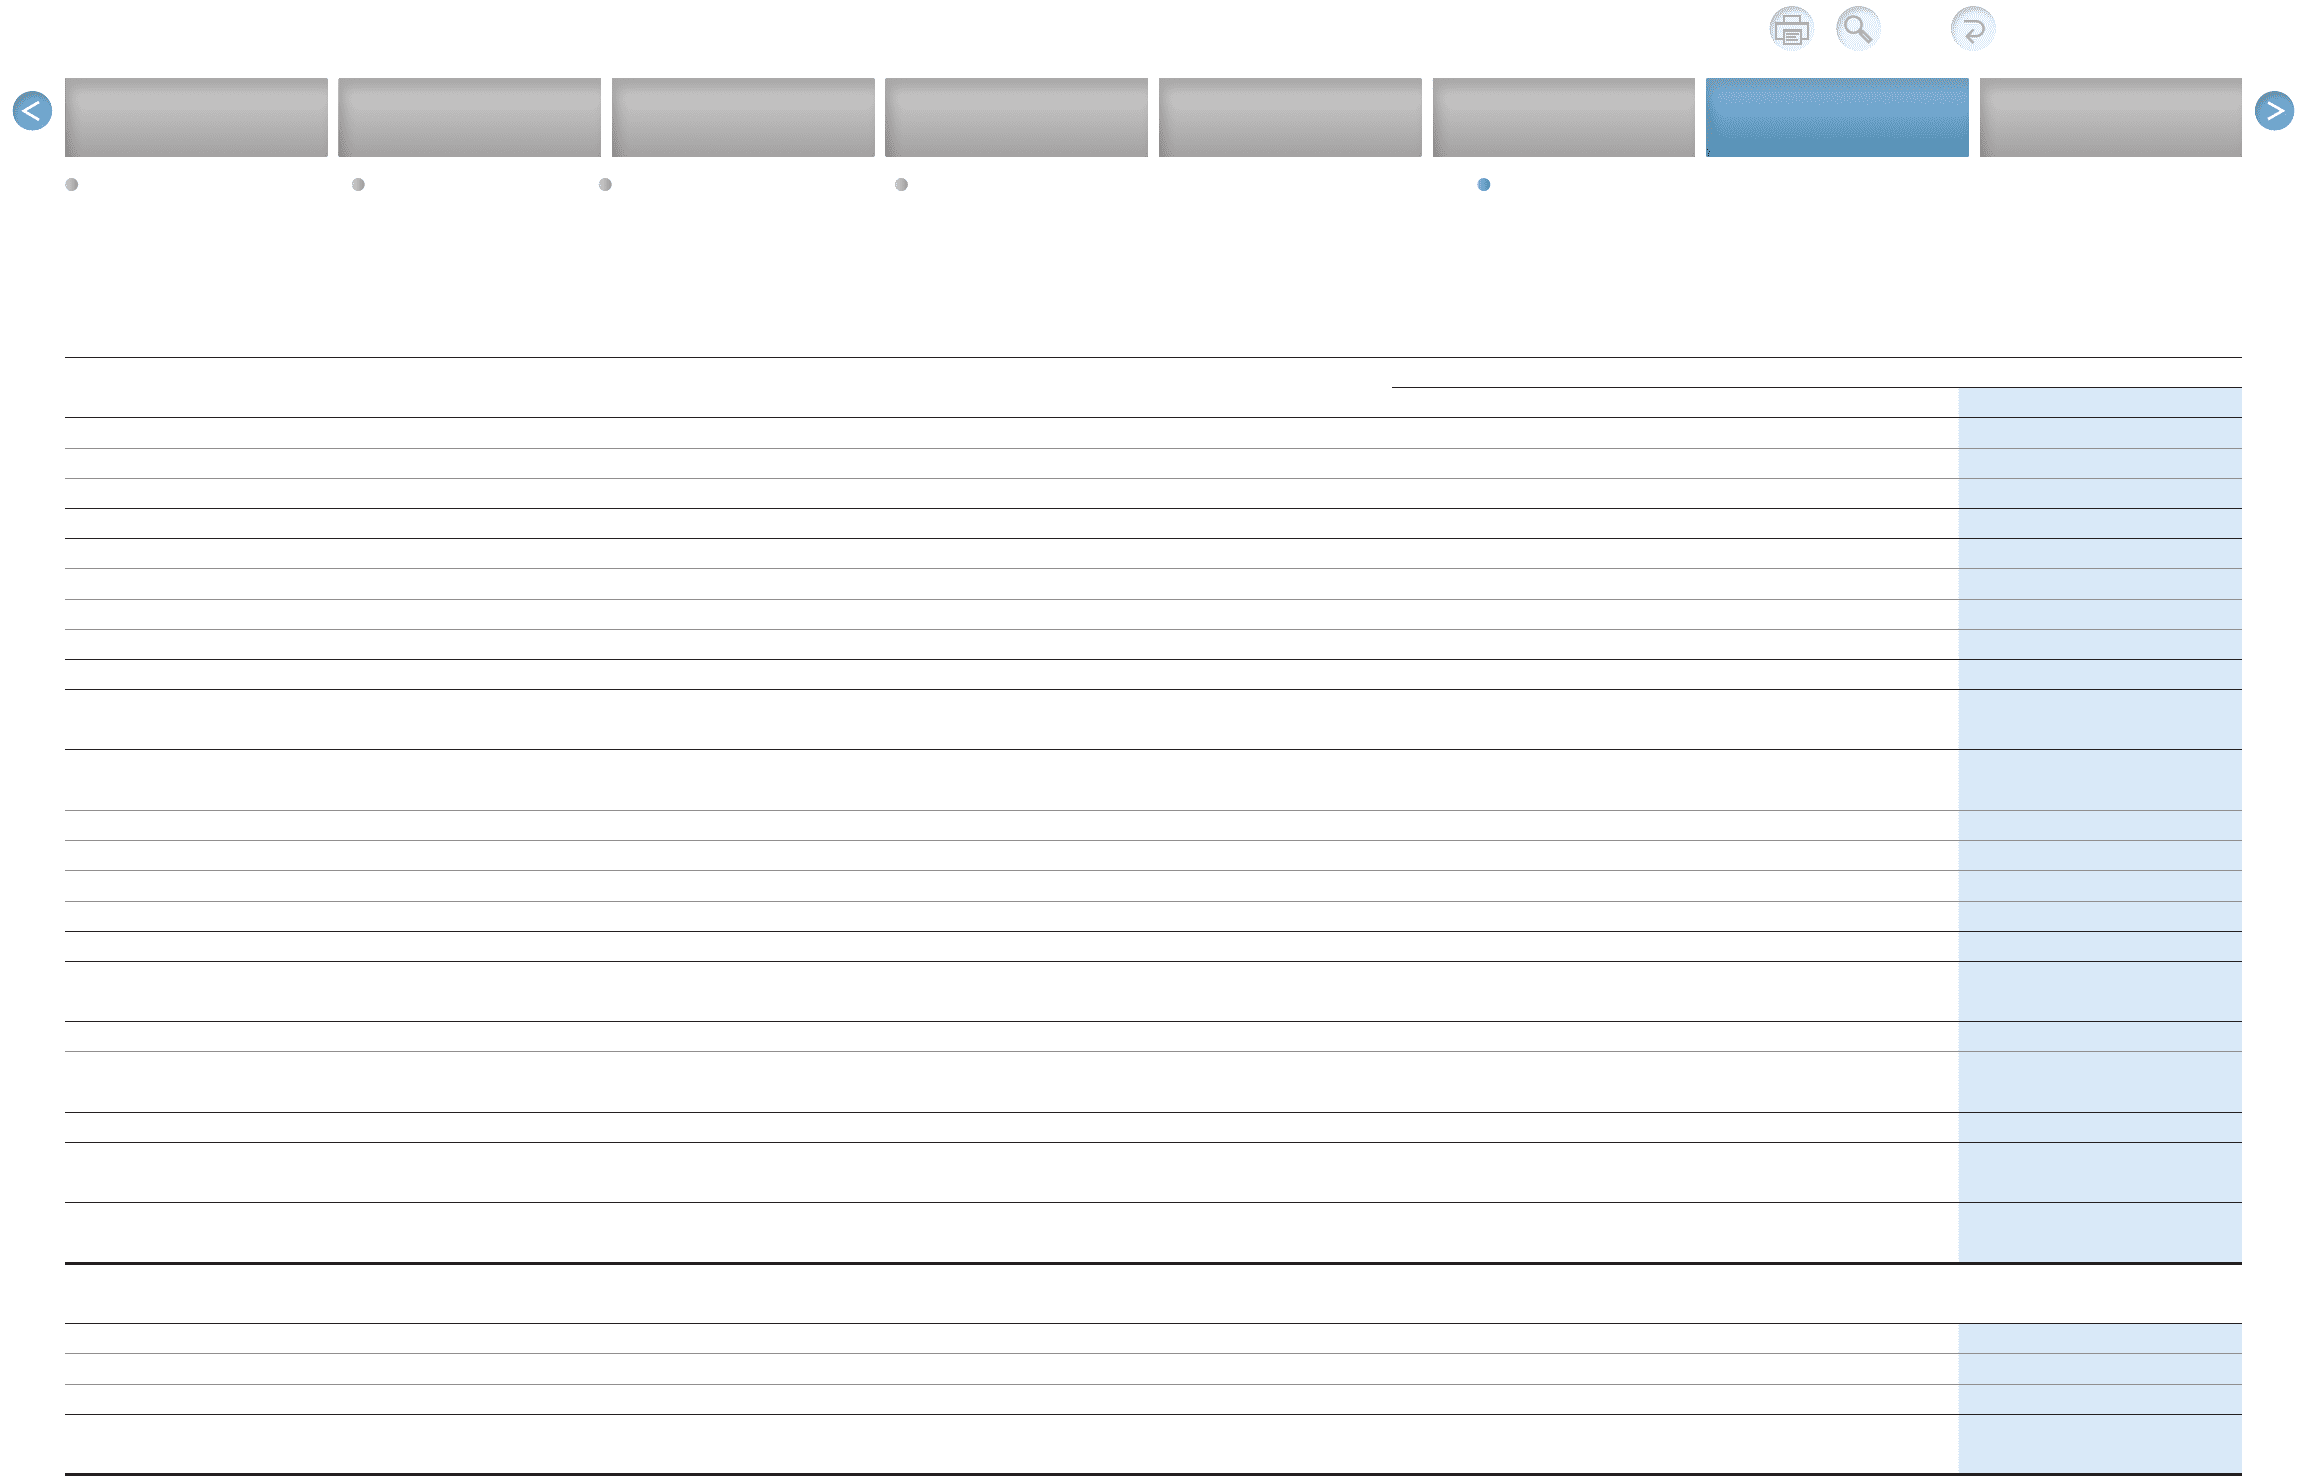
Consolidated Statements of Income
Toyota Motor Corporation
For the years ended March 31, 2012, 2013 and 2014
Yen in millions
2012 2013 2014
Net revenues
Sales of products 17,511,916 20,914,150 24,312,644
Financing operations 1,071,737 1,150,042 1,379,267
Total net revenues 18,583,653 22,064,192 25,691,911
Costs and expenses
Cost of products sold 15,795,918 18,010,569 19,988,245
Cost of financing operations 592,646 630,426 812,894
Selling, general and administrative 1,839,462 2,102,309 2,598,660
Total costs and expenses 18,228,026 20,743,304 23,399,799
Operating income 355,627 1,320,888 2,292,112
Other income (expense)
Interest and dividend income 99,865 98,673 115,410
Interest expense (22,922) (22,967) (19,630)
Foreign exchange gain, net 37,105 5,551 50,260
Other income (loss), net (36,802) 1,504 2,928
Total other income (expense) 77,246 82,761 148,968
Income before income taxes and equity in earnings of affiliated companies 432,873 1,403,649 2,441,080
Provision for income taxes 262,272 551,686 767,808
Equity in earnings of affiliated companies 197,701 231,519 318,376
Net income 368,302 1,083,482 1,991,648
Less: Net income attributable to noncontrolling interests (84,743) (121,319) (168,529)
Net income attributable to Toyota Motor Corporation 283,559 962,163 1,823,119
Yen
Net income attributable to Toyota Motor Corporation per share
— Basic 90.21 303.82 575.30
— Diluted 90.20 303.78 574.92
Cash dividends per share 50.00 90.00 165.00
Selected Financial Summary (U.S. GAAP) Consolidated Segment Information Consolidated Quarterly Financial Summary Management’s Discussion and Analysis of Financial Condition and Results of Operations Consolidated Financial Statements [2 of 5]