Toyota 2014 Annual Report Download - page 29
Download and view the complete annual report
Please find page 29 of the 2014 Toyota annual report below. You can navigate through the pages in the report by either clicking on the pages listed below, or by using the keyword search tool below to find specific information within the annual report.-
 1
1 -
2
-
3
-
4
-
5
-
6
-
7
-
8
-
9
-
10
-
11
-
12
-
13
-
14
-
15
-
16
-
17
-
18
-
 19
19 -
 20
20 -
 21
21 -
 22
22 -
 23
23 -
 24
24 -
 25
25 -
 26
26 -
 27
27 -
 28
28 -
 29
29 -
 30
30 -
 31
31 -
 32
32 -
 33
33 -
 34
34 -
 35
35 -
 36
36 -
 37
37 -
 38
38 -
 39
39 -
40
-
41
-
42
-
43
-
44
-
45
-
46
-
47
-
48
-
49
-
50
-
51
-
52
-
53
-
54
-
55
-
56
-
57
-
58
-
59
-
60
-
61
-
62
-
63
-
64
-
65
-
66
-
67
-
68
 |
 |
ANNUAL REPORT 2014
President’s MessagePresident’s Message
Overview of
Four Business Units
Overview of
Four Business Units
Special FeatureSpecial Feature
Review of OperationsReview of Operations
Consolidated Performance
Highlights
Consolidated Performance
Highlights
Management and
Corporate Information
Management and
Corporate Information
Investor InformationInvestor Information
Financial SectionFinancial Section
Page 29
NextPrev
ContentsSearchPrint
Millions of yen % change
For the years ended
March 31 2010 2011 2012 2013 2014
2014 vs.
2013
Net Revenues by Region:
Japan 11,220,303 10,986,246 11,167,319 12,821,018 14,297,470 +11.5
North America 5,670,526 5,429,136 4,751,886 6,284,425 8,117,099 +29.2
Europe 2,147,049 1,981,497 1,993,946 2,083,113 2,724,959 +30.8
Asia 2,655,327 3,374,534 3,334,274 4,385,476 4,877,672 +11.2
Other* 1,673,861 1,809,116 1,760,175 2,094,265 2,336,641 +11.6
Intersegment elimination/
unallocated amount
(4,416,093) (4,586,841) (4,423,947) (5,604,105) (6,661,930) —
Operating income (loss):
Japan (225,242) (362,396) (207,040) 576,335 1,510,165 +162.0
North America 85,490 339,503 186,409 221,925 326,052 +46.9
Europe (32,955) 13,148 17,796 26,462 58,228 +110.0
Asia 203,527 312,977 256,790 376,055 395,737 +5.2
Other* 115,574 160,129 108,814 133,744 42,568 –68.2
Intersegment elimination/
unallocated amount
1,122 4,918 (7,142) (13,633) (40,638) —
* Central and South America, Oceania, Africa and the Middle East, etc.
25,000
0
20,000
15,000
10,000
5,000
2,000
0
1,500
1,000
500
-500
FY
FY
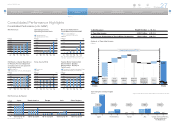
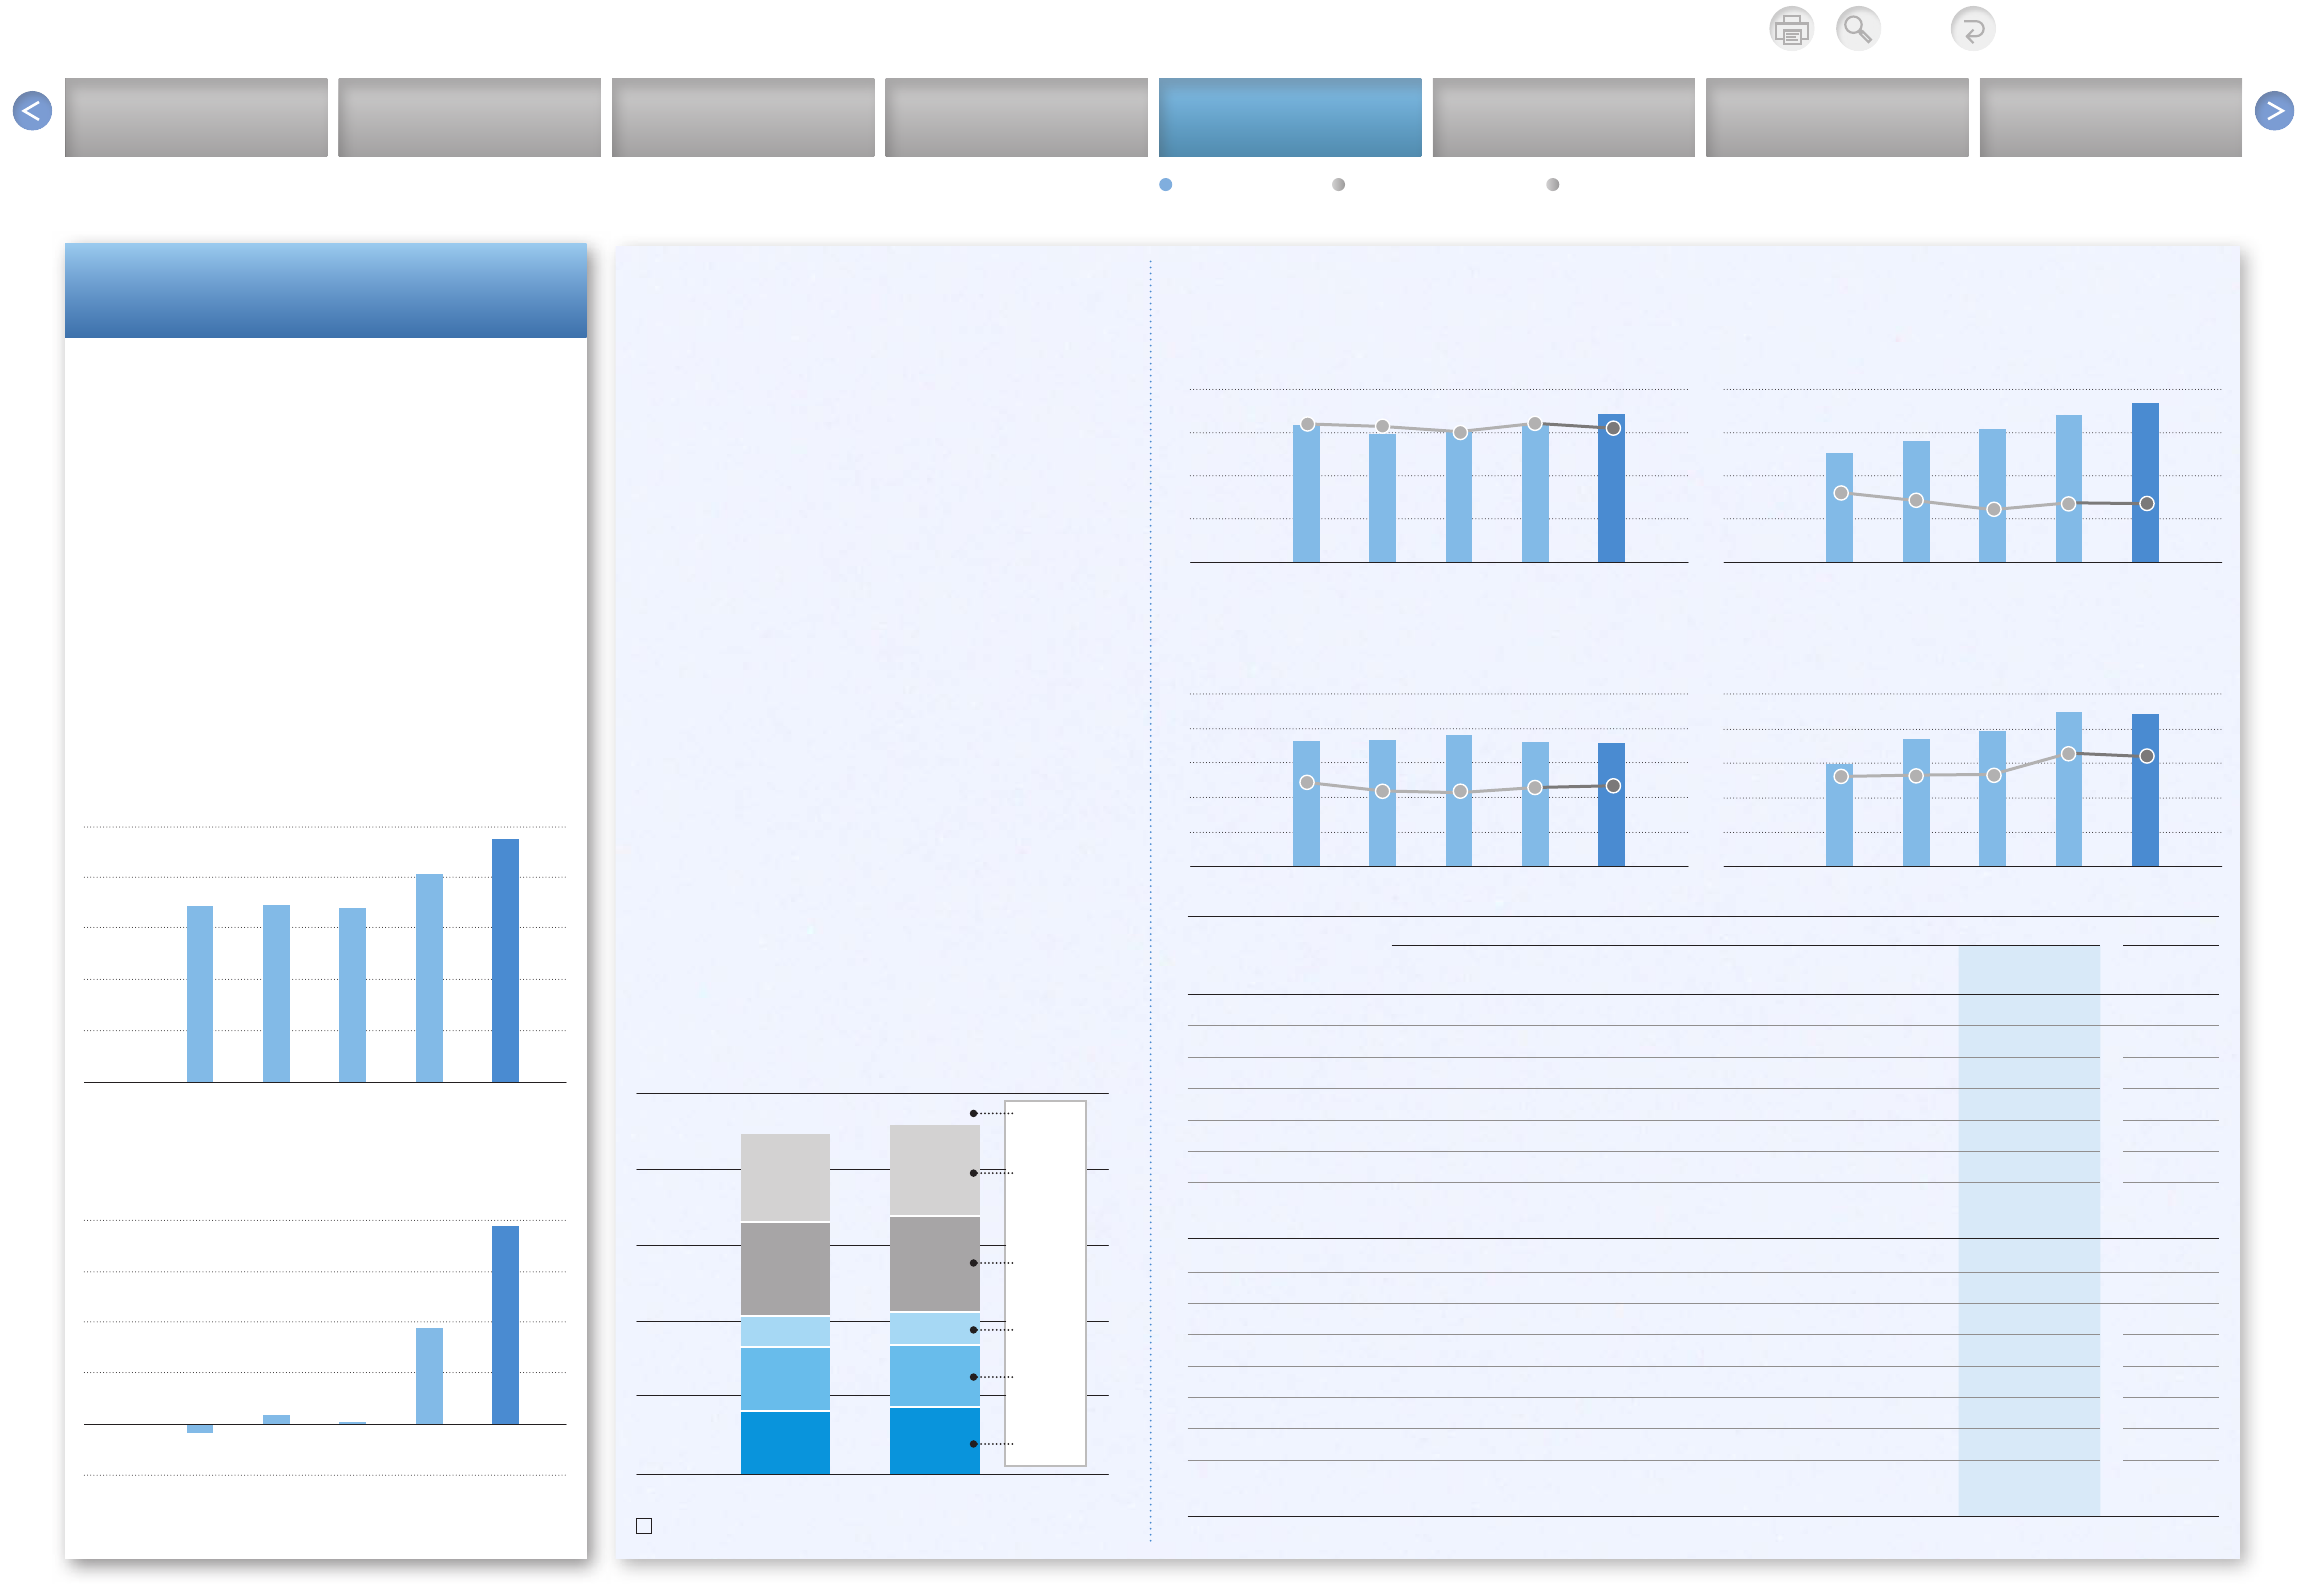
Net Revenues
(¥ Billion)
’10 ’11 ’12 ’13 ’14
Operating Income (Loss)
(¥ Billion)
’10 ’11 ’12 ’13 ’14
Note: Fiscal years ended March 31
The Company works diligently to produce ever-
better cars that exceed expectations in order to
deliver products that bring smiles to the faces of
people who choose Toyota.
In the fiscal year under review, net revenues
from automotive operations totaled ¥23,781.4
billion, an increase of ¥3,362.3 billion, or 16.5%,
compared with the previous fiscal year. On the
earnings front, operating income jumped by
¥994.0 billion, or 105.2%, year on year, to
¥1,938.7 billion.
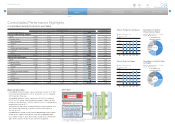
Looking at conditions in the automotive market, trends
mainly in the United States were firm. Certain emerg-
ing markets, on the other hand, showed signs of slow-
ing down. Against this backdrop, Toyota aggressively
introduced new products in Japan and successfully
expanded sales thanks to the efforts of dealers nation-
wide. Outside Japan, the Company boosted vehicle
sales in North America, Europe, and other regions.
Since introducing the world’s first mass-produced
car under the Prius brand name in December 1997,
Toyota has placed considerable emphasis on promot-
ing the widespread use of hybrid vehicles. With sales
having passed the four million mark in April 2012,
demand continued to gather momentum and, within
the relatively short space of approximately nine
months, we saw cumulative hybrid sales of five million
break through the six million mark in January 2014.
Thus, we can confidently say that hybrid vehicles
have now achieved full-fledged market penetration.
10,000
8,000
6,000
4,000
2,000
0
Consolidated Vehicle Sales
(Thousands of units)
Change’14
Japan North America Europe Asia
Other*
FY ’13
9,116
2,365
2,529
844
1,609
1,769
8,871
2,279
2,469
799
1,684
1,640 +129
–75
+45
+60
+86
+245
Source: Toyota Motor Corp.
Note: Market definitions are as follows:
Europe: Germany, France, the United Kingdom, Italy, Spain, the Netherlands,
Belgium, Portugal, Denmark, Greece, Ireland, Sweden, Austria,
Finland, Switzerland, Norway, Poland, Hungary, and the Czech
Republic
Asia: Indonesia, Thailand, the Philippines, Malaysia, Singapore, Vietnam,
Taiwan, South Korea, and Brunei Darussalam
Japan: Mini-vehicles excluded
4,000
2,000
1,000
(Thousands of units)
60
30
3,000 45
15
(%)
20,000
10,000
5,000
(Thousands of units)
40
20
15,000 30
10
(%)
25,000
10,000
5,000
(Thousands of units)
10
4
15,000 6
20,000 8
2
(%)
10,000
4,000
2,000
(Thousands of units)
25
10
6,000 15
8,000 20
5
(%)
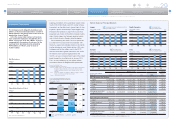
FY
Japan
’10 ’11 ’12 ’13 ’14
0 0
Total market sales (excluding mini-vehicles)
Toyota market share
CY
North America
’09 ’10 ’11 ’12 ’13
0 0
Total market sales
Toyota market share
CY
Europe
’09 ’10 ’11 ’12 ’13
0 0
Total market sales
Toyota market share
CY
Asia
’09 ’10 ’11 ’12 ’13
0 0
Total market sales
Toyota market share
Vehicle Sales by Principal Markets
Automotive Operations
Automotive Operations Financial Services Operations Non-Automotive Business Operations