Toyota 2014 Annual Report Download - page 66
Download and view the complete annual report
Please find page 66 of the 2014 Toyota annual report below. You can navigate through the pages in the report by either clicking on the pages listed below, or by using the keyword search tool below to find specific information within the annual report.-
 1
1 -
2
-
3
-
4
-
5
-
6
-
7
-
8
-
9
-
10
-
11
-
12
-
13
-
14
-
15
-
16
-
17
-
18
-
19
-
20
-
21
-
22
-
23
-
24
-
25
-
26
-
27
-
28
-
29
-
30
-
31
-
32
-
33
-
34
-
35
-
36
-
37
-
38
-
39
-
40
-
41
-
42
-
43
-
44
-
45
-
46
-
47
-
48
-
49
-
50
-
51
-
52
-
53
-
54
-
55
-
 56
56 -
 57
57 -
 58
58 -
 59
59 -
 60
60 -
 61
61 -
 62
62 -
 63
63 -
 64
64 -
 65
65 -
 66
66 -
 67
67 -
 68
68
 |
 |

ANNUAL REPORT 2014
President’s MessagePresident’s Message
Overview of
Four Business Units
Overview of
Four Business Units
Special FeatureSpecial Feature
Review of OperationsReview of Operations
Consolidated Performance
Highlights
Consolidated Performance
Highlights
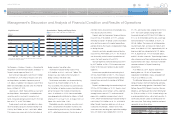
Management and
Corporate Information
Management and
Corporate Information
Investor InformationInvestor Information
Financial SectionFinancial Section
Page 66
NextPrev
ContentsSearchPrint
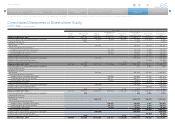
Consolidated Statements of Cash Flows
Toyota Motor Corporation
For the years ended March 31, 2012, 2013 and 2014
Yen in millions
2012 2013 2014
Cash flows from operating activities
Net income 368,302 1,083,482 1,991,648
Adjustments to reconcile net income to
net cash provided by operating activities
Depreciation 1,067,830 1,105,109 1,250,853
Provision for doubtful accounts and
credit losses 9,623 27,367 49,718
Pension and severance costs, less payments 16,711 (20,429) 20,654
Losses on disposal of fixed assets 33,528 32,221 28,657
Unrealized losses on available-for-sale
securities, net 53,831 2,104 6,197
Deferred income taxes 6,395 160,008 (56,279)
Equity in earnings of affiliated companies (197,701) (231,519) (318,376)
Changes in operating assets and liabilities,
and other
Increase in accounts and notes receivable (585,464) (168,260) (121,926)
(Increase) decrease in inventories (344,923) 50,483 (110,819)
Increase in other current assets (180,529) (47,033) (77,645)
Increase (decrease) in accounts payable 756,363 (209,284) 65,312
Increase in accrued income taxes 20,943 22,127 438,527
Increase in other current liabilities 316,366 280,083 277,659
Other 111,160 364,857 201,855
Net cash provided by operating activities 1,452,435 2,451,316 3,646,035
Yen in millions
2012 2013 2014
Cash flows from investing activities
Additions to finance receivables (8,333,248) (10,004,928) (11,953,064)
Collection of finance receivables 8,007,711 9,063,011 10,990,546
Proceeds from sales of finance receivables 53,999 39,845 34,807
Additions to fixed assets excluding equipment
leased to others (723,537) (854,561) (970,021)
Additions to equipment leased to others (808,545) (1,119,591) (1,708,670)
Proceeds from sales of fixed assets excluding
equipment leased to others 36,633 39,191 39,191
Proceeds from sales of equipment leased
to others 431,313 533,441 744,339
Purchases of marketable securities and
security investments (3,173,634) (3,412,423) (4,738,278)
Proceeds from sales of marketable securities
and security investments 162,160 35,178 538,894
Proceeds upon maturity of marketable
securities and security investments 2,694,665 2,633,913 2,780,433
Payment for additional investments in
affiliated companies, net of cash acquired (147) 16,216 6,603
Changes in investments and other assets,
and other 209,972 3,396 (101,028)
Net cash used in investing activities (1,442,658) (3,027,312) (4,336,248)
Cash flows from financing activities
Proceeds from issuance of long-term debt 2,394,807 3,191,223 3,890,310
Payments of long-term debt (2,867,572) (2,682,136) (2,988,923)
Increase in short-term borrowings 311,651 201,261 467,976
Dividends paid to Toyota Motor Corporation
shareholders (156,785) (190,008) (396,030)
Dividends paid to noncontrolling interests (37,356) (45,640) (63,065)
Reissuance (repurchase) of treasury stock (92) 2,542 9,212
Net cash provided by (used in)
financing activities (355,347) 477,242 919,480
Effect of exchange rate changes on cash and
cash equivalents (55,939) 137,851 93,606
Net increase (decrease) in cash and
cash equivalents (401,509) 39,097 322,873
Cash and cash equivalents at beginning of year 2,080,709 1,679,200 1,718,297
Cash and cash equivalents at end of year 1,679,200 1,718,297 2,041,170
Selected Financial Summary (U.S. GAAP) Consolidated Segment Information Consolidated Quarterly Financial Summary Management’s Discussion and Analysis of Financial Condition and Results of Operations Consolidated Financial Statements [5 of 6]