Toyota 2014 Annual Report Download - page 50
Download and view the complete annual report
Please find page 50 of the 2014 Toyota annual report below. You can navigate through the pages in the report by either clicking on the pages listed below, or by using the keyword search tool below to find specific information within the annual report.-
 1
1 -
2
-
3
-
4
-
5
-
6
-
7
-
8
-
9
-
10
-
11
-
12
-
13
-
14
-
15
-
16
-
17
-
18
-
19
-
20
-
21
-
22
-
23
-
24
-
25
-
26
-
27
-
28
-
29
-
30
-
31
-
32
-
33
-
34
-
35
-
36
-
37
-
38
-
39
-
 40
40 -
 41
41 -
 42
42 -
 43
43 -
 44
44 -
 45
45 -
 46
46 -
 47
47 -
 48
48 -
 49
49 -
 50
50 -
 51
51 -
 52
52 -
 53
53 -
 54
54 -
 55
55 -
 56
56 -
 57
57 -
 58
58 -
 59
59 -
 60
60 -
61
-
62
-
63
-
64
-
65
-
66
-
67
-
68
 |
 |
ANNUAL REPORT 2014
President’s MessagePresident’s Message
Overview of
Four Business Units
Overview of
Four Business Units
Special FeatureSpecial Feature
Review of OperationsReview of Operations
Consolidated Performance
Highlights
Consolidated Performance
Highlights
Management and
Corporate Information
Management and
Corporate Information
Investor InformationInvestor Information
Financial SectionFinancial Section
Page 50
NextPrev
ContentsSearchPrint
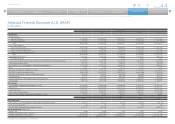
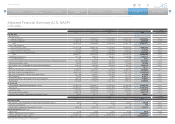
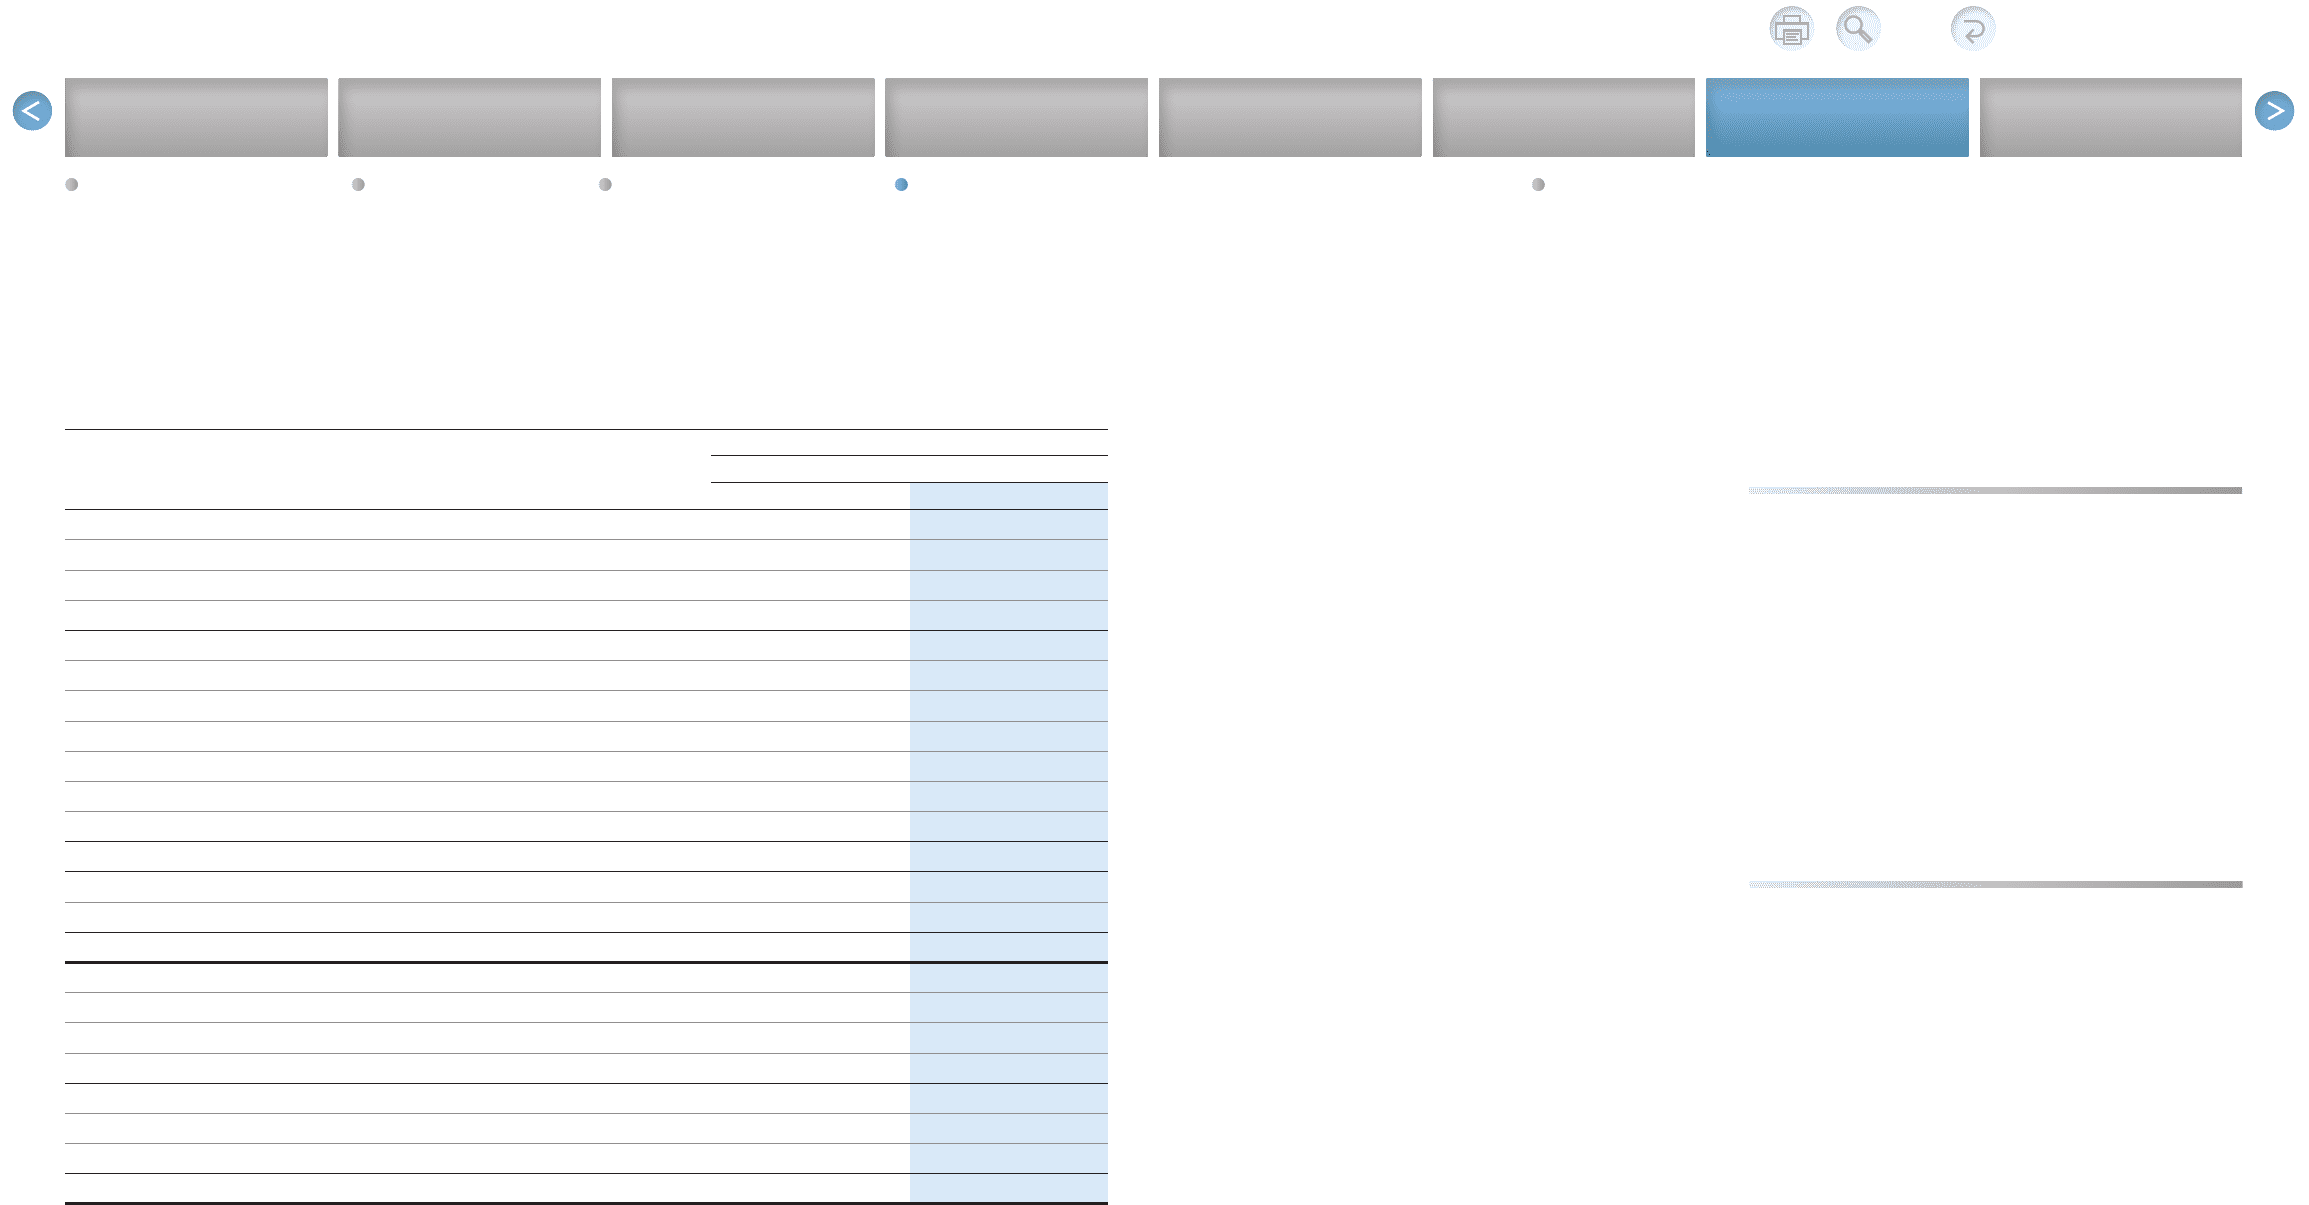
The following table provides information regarding Toyota’s finance receivables and operating leases in the
past two fiscal years.
Yen in millions
March 31,
2013 2014
Finance Receivables
Retail 9,047,782 10,523,364
Finance leases 1,029,887 1,071,179
Wholesale and other dealer loans 2,615,728 2,875,650
12,693,397 14,470,193
Deferred origination costs 135,398 161,956
Unearned income (628,340) (754,539)
Allowance for credit losses
Retail (83,858) (89,439)
Finance leases (28,928) (30,585)
Wholesale and other dealer loans (26,243) (26,358)
(139,029) (146,382)
Total finance receivables, net 12,061,426 13,731,228
Less—Current portion (5,117,660) (5,628,934)
Noncurrent finance receivables, net 6,943,766 8,102,294
Operating Leases
Vehicles 2,999,294 3,674,969
Equipment 104,351 129,029
Less—Deferred income and other (65,634) (94,438)
3,038,011 3,709,560
Less—Accumulated depreciation (749,238) (808,764)
Less—Allowance for credit losses (8,020) (7,220)
Vehicles and equipment on operating leases, net 2,280,753 2,893,576
the end of the lease term. See discussion in “Critical
Accounting Estimates — Investment in Operating
Leases” and note 2 to the consolidated financial
statements in Toyota’s annual report on Form 20-F.
Toyota enters into interest rate swap agreements
and cross currency interest rate swap agreements
to convert its fixed-rate debt to variable-rate func-
tional currency debt. A portion of the derivative
instruments are entered into to hedge interest rate
risk from an economic perspective and are not des-
ignated as a hedge of specific assets or liabilities on
Toyota’s consolidated balance sheet and according-
ly, unrealized gains or losses related to derivatives
that are not designated as a hedge are recognized
currently in operations. See discussion in “Critical
Accounting Estimates — Derivatives and Other
Contracts at Fair Value” and “Quantitative and
Qualitative Disclosures about Market Risk” and notes
20 and 26 to the consolidated financial statements
in Toyota’s annual report on Form 20-F.
The fluctuations in funding costs can affect the
profitability of Toyota’s financial services operations.
Funding costs are affected by a number of factors,
some of which are not in Toyota’s control. These
factors include general economic conditions, pre-
vailing interest rates and Toyota’s financial strength.
Funding costs decreased during fiscal 2013 and
2014, mainly as a result of lower interest rates.
Toyota launched its credit card business in Japan
in April 2001. As of March 31, 2014, Toyota had
12.7 million cardholders, an increase of 0.9 million
cardholders compared with March 31, 2013. Credit
card receivables as of March 31, 2014 increased by
¥42.8 billion from March 31, 2013 to ¥380.9 billion.
Toyota’s other business operations consist of hous-
ing (including the manufacture and sale of prefabri-
cated homes), information technology related
businesses (including information technology and
telecommunications, intelligent transport systems
and GAZOO) and other businesses.
Toyota does not expect its other business opera-
tions to materially contribute to Toyota’s consolidat-
ed results of operations.
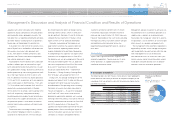
Toyota is affected by fluctuations in foreign currency
exchange rates. Toyota is exposed to fluctuations in
the value of the Japanese yen against the U.S. dol-
lar and the euro and, to a lesser extent, the
Australian dollar, the Russian ruble, the Canadian
dollar, the British pound, and others. Toyota’s con-
solidated financial statements, which are presented
in Japanese yen, are affected by foreign currency
exchange fluctuations through both translation risk
and transaction risk.
Translation risk is the risk that Toyota’s consoli-
dated financial statements for a particular period or
for a particular date will be affected by changes in
the prevailing exchange rates of the currencies in
those countries in which Toyota does business
compared with the Japanese yen. Even though the
fluctuations of currency exchange rates to the
Toyota’s finance receivables are subject to col-
lectability risks. These risks include consumer and
dealer insolvencies and insufficient collateral values
(less costs to sell) to realize the full carrying values
of these receivables. See discussion in “Critical
Accounting Estimates — Allowance for Doubtful
Accounts and Credit Losses” and note 10 to the
consolidated financial statements in Toyota’s annual
report on Form 20-F.
Toyota continues to originate leases to finance
new Toyota vehicles. These leasing activities are
subject to residual value risk. Residual value losses
could be incurred when the lessee of a vehicle does
not exercise the option to purchase the vehicle at
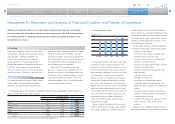
Management’s Discussion and Analysis of Financial Condition and Results of Operations
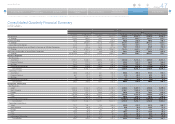
Selected Financial Summary (U.S. GAAP) Consolidated Segment Information Consolidated Quarterly Financial Summary Management’s Discussion and Analysis of Financial Condition and Results of Operations [3 of 14] Consolidated Financial Statements
Other Business Operations
Currency Fluctuations