Toyota 2014 Annual Report Download - page 30
Download and view the complete annual report
Please find page 30 of the 2014 Toyota annual report below. You can navigate through the pages in the report by either clicking on the pages listed below, or by using the keyword search tool below to find specific information within the annual report.-
 1
1 -
2
-
3
-
4
-
5
-
6
-
7
-
8
-
9
-
10
-
11
-
12
-
13
-
14
-
15
-
16
-
17
-
18
-
19
-
 20
20 -
 21
21 -
 22
22 -
 23
23 -
 24
24 -
 25
25 -
 26
26 -
 27
27 -
 28
28 -
 29
29 -
 30
30 -
 31
31 -
 32
32 -
 33
33 -
 34
34 -
 35
35 -
 36
36 -
 37
37 -
 38
38 -
 39
39 -
 40
40 -
41
-
42
-
43
-
44
-
45
-
46
-
47
-
48
-
49
-
50
-
51
-
52
-
53
-
54
-
55
-
56
-
57
-
58
-
59
-
60
-
61
-
62
-
63
-
64
-
65
-
66
-
67
-
68
 |
 |
ANNUAL REPORT 2014
President’s MessagePresident’s Message
Overview of
Four Business Units
Overview of
Four Business Units
Special FeatureSpecial Feature
Review of OperationsReview of Operations
Consolidated Performance
Highlights
Consolidated Performance
Highlights
Management and
Corporate Information
Management and
Corporate Information
Investor InformationInvestor Information
Financial SectionFinancial Section
Page 30
NextPrev
ContentsSearchPrint
1,500
0
1,200
900
600
300
FY
400
0
300
200
100
FY
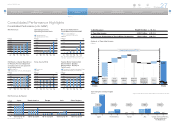
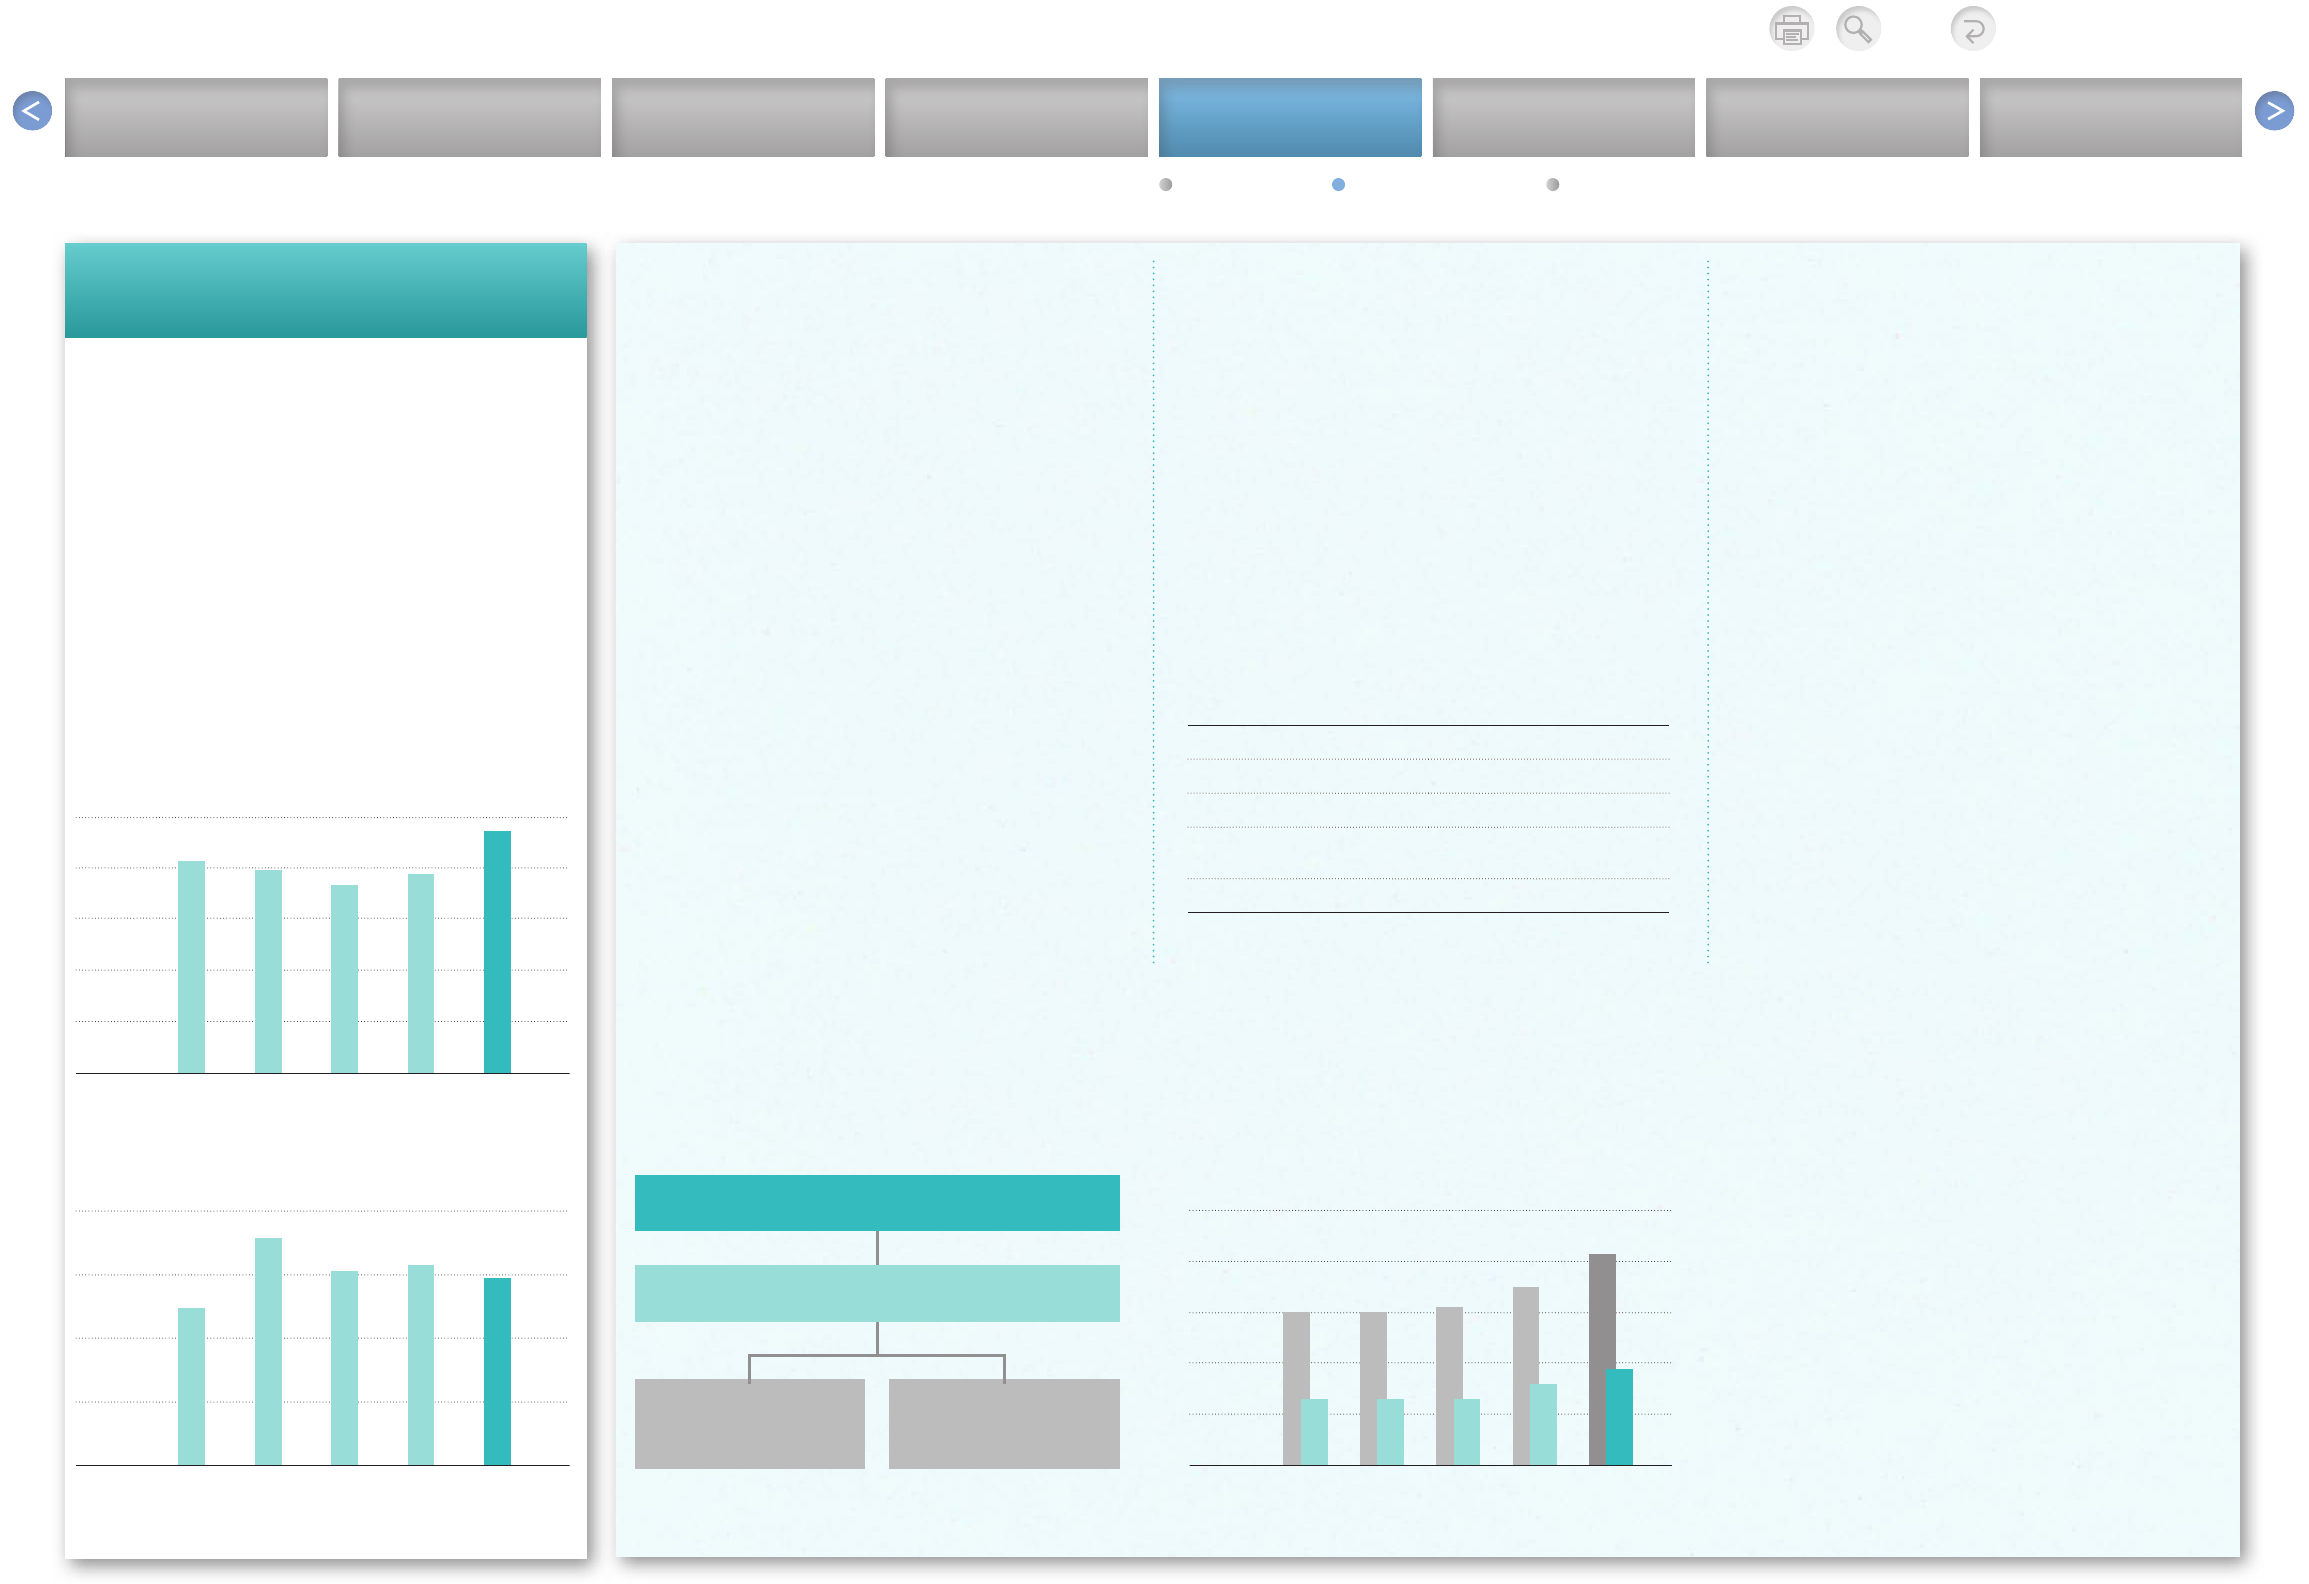
Net Revenues
(¥ Billion)
’10 ’11 ’12 ’13 ’14
Operating Income
(¥ Billion)
’10 ’11 ’12 ’13 ’14
Note: Fiscal years ended March 31
Toyota’s financial services operations are primarily
handled by Toyota Financial Services Corporation
(TFS), which has overall control of financial services
subsidiaries worldwide. TFS provides financial services
primarily for vehicle purchases and leases to approxi-
mately 9.6 million customers in 35 countries and
regions worldwide.
During the period under review, we continued with
last year’s efforts to strengthen regional strategies by
enhancing our relationships with distributors through the
provision of financial products and services meeting vari-
ous national and regional customer characteristics.
TFS continued to broaden its connections with
customers in Japan, responding to their needs by
offering ready access to sound financial services such
as credit cards and housing loans in addition to auto-
motive financing.
On the global front, the Toyota Group is aggressively
expanding its business in emerging markets. In
January 2013, the Company established Toyota Motor
Leasing (China) Co., Ltd., which opened its doors for
business in April 2013. In the same month, Toyota
established the financial services company, Toyota
Financial Services Kazakhstan MFO LLP, which
commenced business in January 2014.
In such major markets as Europe and the United
States, TFS aims to ensure stable earnings by working
to secure margins and achieve thorough low-cost
operations with consideration for vehicle sales support
and the balancing of business risks.
To respond to dramatic changes in the business
environment, TFS will strengthen groupwide compli-
ance and risk management structures while focusing
on enhancements to its business platform, such as IT
platform development and human resource cultivation
in management.
Overview of Toyota’s Financial Services Operations
Total assets ¥18,943.5 billion
Net revenues ¥1,421.0 billion
Operating income ¥294.8 billion
Operating areas 34 countries and regions
worldwide
Number of employees approx. 9,000
(As of March 31, 2014)
50
0
30
40
20
10
FY
Note: Fiscal years ended March 31
Total Assets
(¥ Trillion)
’10 ’11 ’12 ’13 ’14
Toyota (Consolidated) TFS
Financial Services Operations Organization
Overseas Sales Finance
Companies Toyota Finance Corporation
Toyota Motor Corporation
Toyota Financial Services Corporation
Toyota offers automotive financing and a variety
of other financial services for total support of
customer lifestyles.
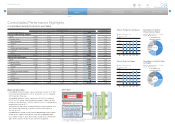
In the fiscal year ended March 31, 2014, net
revenues from financial service operations
amounted to ¥1,421.0 billion, up ¥250.3 billion, or
21.4%, compared with the previous fiscal year. In
contrast, operating income declined ¥20.9 billion,
or 6.6%, year on year, to ¥294.8 billion. The
decrease in operating income was mainly due to
the recording by sales finance subsidiaries of
valuation losses on interest rate swaps stated at
fair value.
Financial Services Operations
Automotive Operations Financial Services Operations Non-Automotive Business Operations