Toyota 2014 Annual Report Download - page 28
Download and view the complete annual report
Please find page 28 of the 2014 Toyota annual report below. You can navigate through the pages in the report by either clicking on the pages listed below, or by using the keyword search tool below to find specific information within the annual report.-
 1
1 -
2
-
3
-
4
-
5
-
6
-
7
-
8
-
9
-
10
-
11
-
12
-
13
-
14
-
15
-
16
-
17
-
 18
18 -
 19
19 -
 20
20 -
 21
21 -
 22
22 -
 23
23 -
 24
24 -
 25
25 -
 26
26 -
 27
27 -
 28
28 -
 29
29 -
 30
30 -
 31
31 -
 32
32 -
 33
33 -
 34
34 -
 35
35 -
 36
36 -
 37
37 -
 38
38 -
39
-
40
-
41
-
42
-
43
-
44
-
45
-
46
-
47
-
48
-
49
-
50
-
51
-
52
-
53
-
54
-
55
-
56
-
57
-
58
-
59
-
60
-
61
-
62
-
63
-
64
-
65
-
66
-
67
-
68
 |
 |
[3 of 3]
ANNUAL REPORT 2014
President’s MessagePresident’s Message
Overview of
Four Business Units
Overview of
Four Business Units
Special FeatureSpecial Feature
Review of OperationsReview of Operations
Consolidated Performance
Highlights
Consolidated Performance
Highlights
Management and
Corporate Information
Management and
Corporate Information
Investor InformationInvestor Information
Financial SectionFinancial Section
Page 28
NextPrev
ContentsSearchPrint
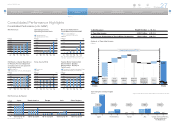
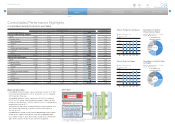
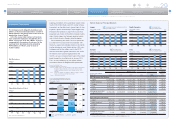
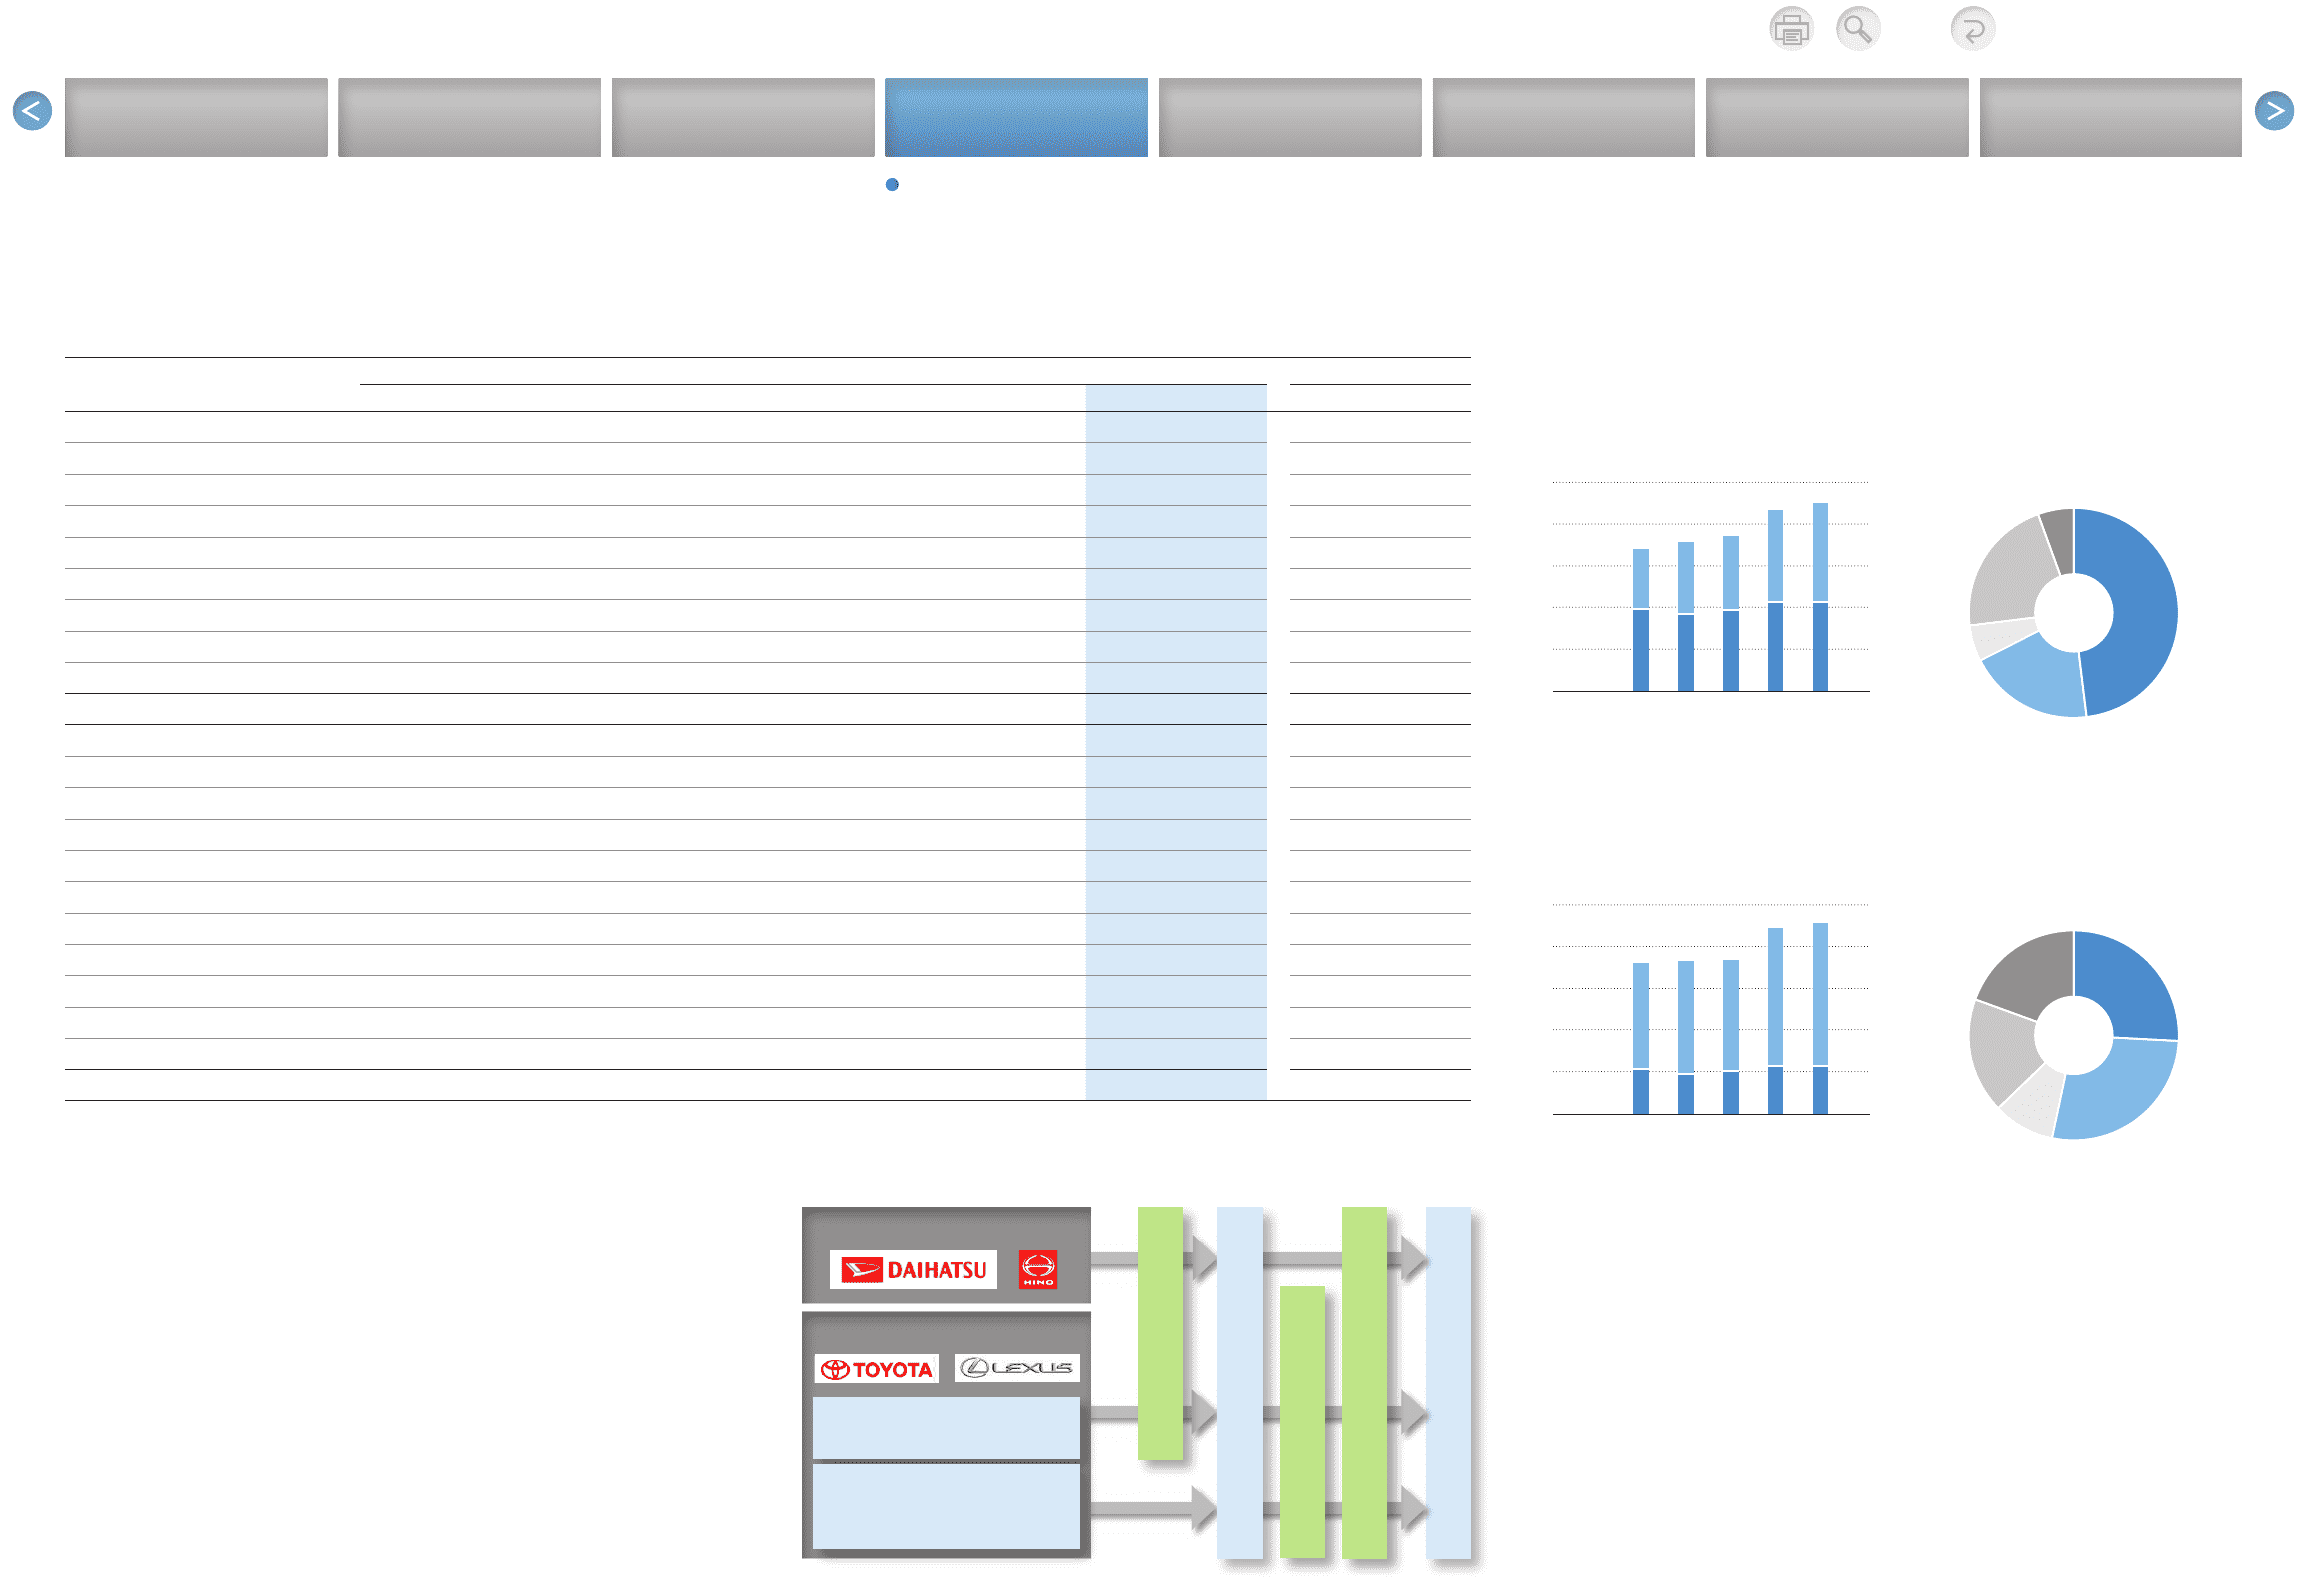
Consolidated Performance Highlights
Consolidated Vehicle Production and Sales
Thousands of units % change
Fiscal years ended March 31 2010 2011 2012 2013 2014 2014 vs. 2013
Vehicle Production by Region:
Japan 3,956 3,721 3,940 4,276 4,345 +1.6
Overseas Total 2,853 3,448 3,495 4,422 4,687 +6.0
North America 1,042 1,338 1,275 1,677 1,759 +4.9
Europe 433 372 383 368 506 +37.5
Asia 1,021 1,344 1,441 1,924 1,939 +0.8
Central and South America 146 148 152 205 242 +18.0
Oceania 106 113 93 100 103 +3.0
Africa 105 133 151 148 138 –6.8
Consolidated Total 6,809 7,169 7,435 8,698 9,032 +3.8
Vehicle Sales by Region:
Japan 2,163 1,913 2,071 2,279 2,365 +3.8
Overseas Total 5,074 5,395 5,281 6,592 6,751 +2.4
North America 2,098 2,031 1,872 2,469 2,529 +2.4
Europe 858 796 798 799 844 +5.6
Asia 979 1,255 1,327 1,684 1,609 –4.5
Central and South America 231 281 289 364 413 +13.5
Oceania 251 248 223 271 259 –4.4
Africa 184 209 214 259 267 +3.1
Middle East 466 569 550 741 824 +11.2
Other 7 6 8 5 6 +20.0
Consolidated Total 7,237 7,308 7,352 8,871 9,116 +2.8
10,000
0
6,000
2,000
4,000
8,000
10,000
0
6,000
2,000
4,000
8,000
’10 ’11 ’12 ’13 ’14
’10 ’11 ’12 ’13 ’14
48.1%
19.5%
5.6%
21.5%
5.3%
25.9%
27.7%
9.3%
17.7%
19.4%
Japan Overseas Total Japan North America Europe
Asia Other Regions
Vehicle Production by Region
(Thousands of units)
FY
Breakdown of Vehicle
Production by Region
Consolidated Total:
9,032 thousand units
FY2014
Japan Overseas Total Japan North America Europe
Asia Other Regions
Vehicle Sales by Region
(Thousands of units)
FY
Breakdown of Vehicle Sales
by Region
Consolidated Total:
9,116 thousand units
FY2014
[Reference] Vehicle Sales
> Consolidated vehicle unit sales in Japan and overseas came to 9,116,000
in the fiscal year ended March 31, 2014, up 245,000, or 2.8%, compared
with the previous fiscal year.
> Consolidated vehicle unit sales in Japan were 2,365,000, an increase of
86,000, or 3.8%, year on year. Excluding mini-vehicles, Toyota and Lexus
vehicle unit sales (retail) was 1,648,000, up 36,000, or 2.2%, representing a
record market share of 46.7%.
> Total vehicle unit sales (retail), including the Daihatsu and Hino brands, was
also a historic high, reaching 10,133,000, a year-on-year increase of
441,000, or 4.6%.
> Consolidated Lexus vehicle unit sales came to approximately 540,000, around
44,000, or 8.8%, higher than the previous fiscal year. By geographic region,
Lexus vehicle unit sales in Japan, North America, Europe, Asia, and other were
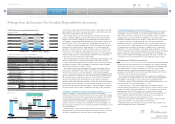
about 48,000, 300,000, 45,000, 92,000, and 55,000, respectively. * There are a limited number of exceptional cases where sales are made other than
in accordance with the flowchart above.
Customers
Vehicle Sales
Daihatsu- and Hino-Brand VehiclesDaihatsu- and Hino-Brand Vehicles
Toyota- and Lexus-Brand VehiclesToyota- and Lexus-Brand Vehicles
Number of vehicles produced for
wholesale by Toyota Motor Corporation
and its consolidated subsidiaries
Number of vehicles produced for
wholesale by Toyota’s
affiliates outside consolidation
(e.g.JVafliatesinChina)
Distributors or Dealers outside consolidation
Toyota and Lexus Vehicle Sales
Consolidated Vehicle Sales
Toyota Retail Vehicle Sales