Toyota 2014 Annual Report Download - page 59
Download and view the complete annual report
Please find page 59 of the 2014 Toyota annual report below. You can navigate through the pages in the report by either clicking on the pages listed below, or by using the keyword search tool below to find specific information within the annual report.-
 1
1 -
2
-
3
-
4
-
5
-
6
-
7
-
8
-
9
-
10
-
11
-
12
-
13
-
14
-
15
-
16
-
17
-
18
-
19
-
20
-
21
-
22
-
23
-
24
-
25
-
26
-
27
-
28
-
29
-
30
-
31
-
32
-
33
-
34
-
35
-
36
-
37
-
38
-
39
-
40
-
41
-
42
-
43
-
44
-
45
-
46
-
47
-
48
-
 49
49 -
 50
50 -
 51
51 -
 52
52 -
 53
53 -
 54
54 -
 55
55 -
 56
56 -
 57
57 -
 58
58 -
 59
59 -
 60
60 -
 61
61 -
 62
62 -
 63
63 -
 64
64 -
 65
65 -
 66
66 -
 67
67 -
 68
68
 |
 |
ANNUAL REPORT 2014
President’s MessagePresident’s Message
Overview of
Four Business Units
Overview of
Four Business Units
Special FeatureSpecial Feature
Review of OperationsReview of Operations
Consolidated Performance
Highlights
Consolidated Performance
Highlights
Management and
Corporate Information
Management and
Corporate Information
Investor InformationInvestor Information
Financial SectionFinancial Section
Page 59
NextPrev
ContentsSearchPrint
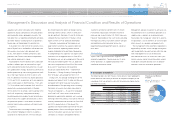
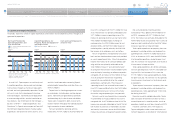
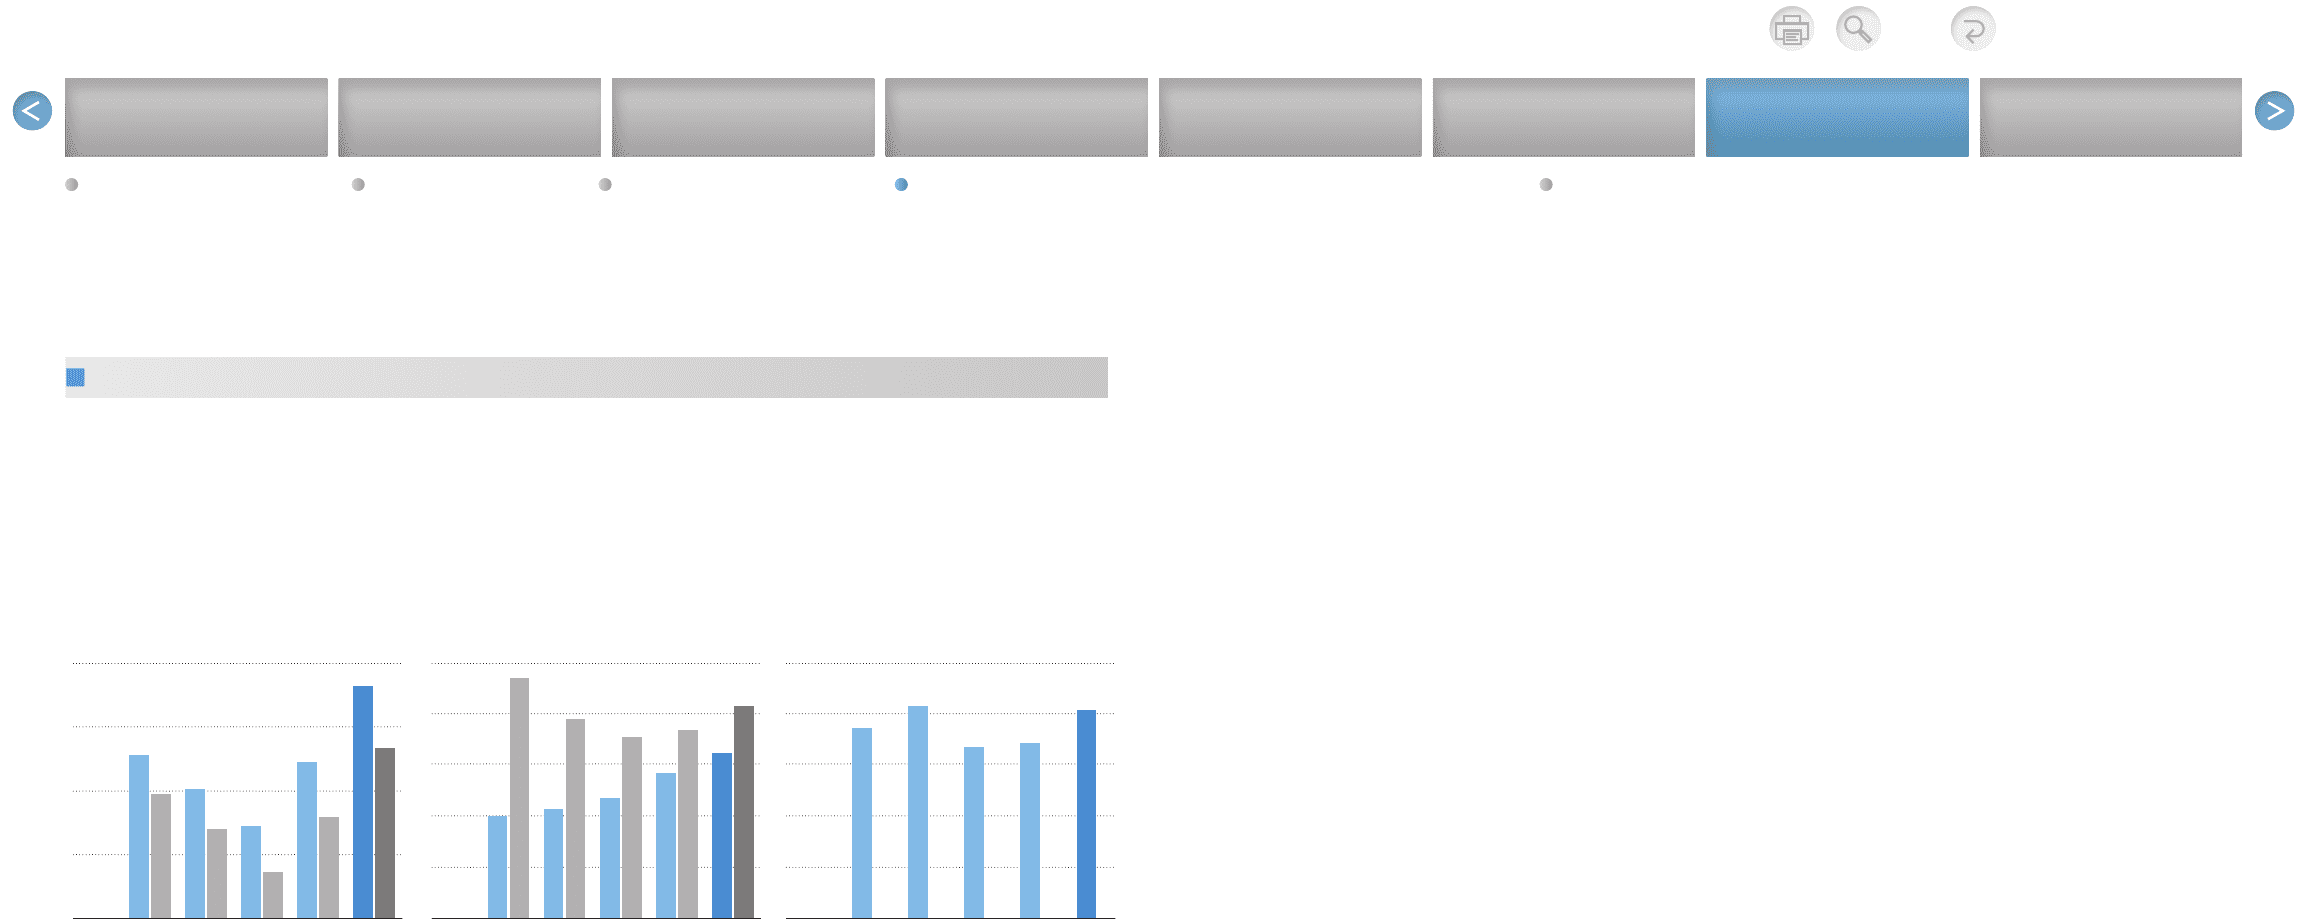
Historically, Toyota has funded its capital expenditures and research and development activities through cash
generated by operations.
4,000
0
3,000
2,000
1,000
1,500
0
1,200
900
600
300
2,500
0
2,000
1,500
1,000
500
Net Cash Provided by
Operating Activities and
Free Cash Flow*
* (Net cash provided by operating activities)-
(Capital expenditures for property, plant and
equipment, excluding vehicles and
equipment on operating leases)
Net cash provided by operating activities
Free cash flow
(¥ Billion)
FY ’10 ’11 ’12 ’13 ’14
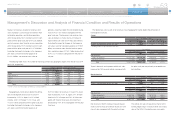
Capital Expenditures for
Property, Plant and Equipment*
and Depreciation
* Excluding vehicles and equipment on operating leases
Capital expenditures Depreciation
(¥ Billion)
FY ’10 ’11 ’12 ’13 ’14
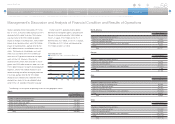
Cash and Cash Equivalents
at End of Year
(¥ Billion)
FY ’10 ’11 ’12 ’13 ’14
In fiscal 2015, Toyota expects to sufficiently fund
its capital expenditures and research and develop-
ment activities through cash and cash equivalents
on hand, and cash generated by operations. Toyota
will use its funds for the development of environ-
ment technologies, maintenance and replacement
of manufacturing facilities, and the introduction of
new products. See “Information on the Company —
Business Overview — Capital Expenditures and
Divestitures” in Toyota’s annual report on Form-20F
for information regarding Toyota’s material capital
expenditures and divestitures for fiscal 2012, 2013
and 2014, and information concerning Toyota’s
principal capital expenditures and divestitures cur-
rently in progress.
Toyota funds its financing programs for custom-
ers and dealers, including loans and leasing pro-
grams, from both cash generated by operations
and borrowings by its sales finance subsidiaries.
Toyota seeks to expand its ability to raise funds
locally in markets throughout the world by expand-
ing its network of finance subsidiaries.
Net cash provided by operating activities
increased by ¥1,194.7 billion to ¥3,646.0 billion for
fiscal 2014, compared with ¥2,451.3 billion for fiscal
2013. The increase was primarily attributable to the
¥971.2 billion increase in operating income. This
increase in operating income was due mainly to the
¥900.0 billion favorable impact of changes in
exchange rates, the ¥290.0 billion impact of cost
reduction efforts and the ¥180.0 billion impact of
marketing efforts, partially offset by the ¥480.0 bil-
lion increase in miscellaneous costs and others.
Results of operations are recorded on an accrual
basis and are therefore different from cash provided
or used in operating activities. Other than operating
income, the increase of net cash provided by oper-
ating activities was primarily attributable to the
¥438.5 billion increase in “accrued income taxes”
resulting from the increase in income before income
taxes and equity in earnings of affiliated companies,
compared with an increase of ¥22.1 billion for fiscal
2013 resulting from the increase in operating
income that was partially offset by the usage of
operating loss carryforwards. The increases in
“operating income” and “accrued income taxes” in
fiscal 2014 were partially offset by the ¥160.0 billion
in “deferred income taxes” for fiscal 2013 mainly
due to the usage of operating loss carryforwards.
Net cash used in investing activities increased by
¥1,308.9 billion to ¥4,336.2 billion for fiscal 2014,
compared with ¥3,027.3 billion for fiscal 2013. The
increase was primarily attributable to the ¥675.6 bil-
lion increase in purchases of marketable securities
and security investments and to the ¥589.0 billion
increase in purchases of equipment leased to others.
Net cash provided by financing activities
increased by ¥442.2 billion to ¥919.4 billion for fis-
cal 2014, compared with ¥477.2 billion for fiscal
2013. The increase was primarily attributable to the
¥699.0 billion increase in proceeds from issuance of
long-term debt, partially offset by the ¥306.7 billion
increase in payments of long-term debt.
Total capital expenditures for property, plant and
equipment, excluding vehicles and equipment on
operating leases, were ¥970.0 billion during fiscal
2014, an increase of 13.5% from the ¥854.5 billion
in total capital expenditures during the prior fiscal
year. This increase was due primarily to an increase
in investments in Japan and Asia.
Total capital expenditures for vehicles and equip-
ment on operating leases were ¥1,708.6 billion dur-
ing fiscal 2014, an increase of 52.6% from the
¥1,119.5 billion in total capital expenditures during
the prior fiscal year. This increase was due primarily
to an increase in investments in the financial servic-
es operations.
Toyota expects investments in property, plant and
equipment, excluding vehicles and equipment on
operating leases, to be approximately ¥1,020.0 bil-
lion during fiscal 2015.
Based on currently available information, Toyota
does not expect environmental matters to have a
material impact on its financial position, results of
operations, liquidity or cash flows during fiscal 2015.
However, uncertainty exists with respect to
Toyota’s obligations under current and future envi-
ronment regulations as described in “Information on
Liquidity and Capital Resources
Selected Financial Summary (U.S. GAAP) Consolidated Segment Information Consolidated Quarterly Financial Summary Management’s Discussion and Analysis of Financial Condition and Results of Operations [12 of 14] Consolidated Financial Statements