Toyota 2014 Annual Report Download - page 44
Download and view the complete annual report
Please find page 44 of the 2014 Toyota annual report below. You can navigate through the pages in the report by either clicking on the pages listed below, or by using the keyword search tool below to find specific information within the annual report.-
 1
1 -
2
-
3
-
4
-
5
-
6
-
7
-
8
-
9
-
10
-
11
-
12
-
13
-
14
-
15
-
16
-
17
-
18
-
19
-
20
-
21
-
22
-
23
-
24
-
25
-
26
-
27
-
28
-
29
-
30
-
31
-
32
-
33
-
 34
34 -
 35
35 -
 36
36 -
 37
37 -
 38
38 -
 39
39 -
 40
40 -
 41
41 -
 42
42 -
 43
43 -
 44
44 -
 45
45 -
 46
46 -
 47
47 -
 48
48 -
 49
49 -
 50
50 -
 51
51 -
 52
52 -
 53
53 -
 54
54 -
55
-
56
-
57
-
58
-
59
-
60
-
61
-
62
-
63
-
64
-
65
-
66
-
67
-
68
 |
 |
ANNUAL REPORT 2014
President’s MessagePresident’s Message
Overview of
Four Business Units
Overview of
Four Business Units
Special FeatureSpecial Feature
Review of OperationsReview of Operations
Consolidated Performance
Highlights
Consolidated Performance
Highlights
Management and
Corporate Information
Management and
Corporate Information
Investor InformationInvestor Information
Financial SectionFinancial Section
Page 44
NextPrev
ContentsSearchPrint
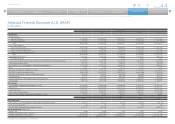
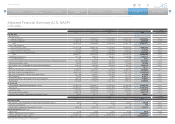
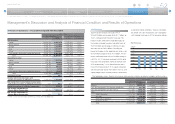
Yen in millions
2005 2006 2007 2008 2009
For the Year:
Net Revenues:
Sales of Products 17,790,862 20,059,493 22,670,097 24,820,510 19,173,720
Financing Operations 760,664 977,416 1,277,994 1,468,730 1,355,850
Total 18,551,526 21,036,909 23,948,091 26,289,240 20,529,570
Costs and Expenses:
Cost of Products Sold 14,500,282 16,335,312 18,356,255 20,452,338 17,468,416
Cost of Financing Operations 369,844 609,632 872,138 1,068,015 987,384
Selling, General and Administrative 2,009,213 2,213,623 2,481,015 2,498,512 2,534,781
Total 16,879,339 19,158,567 21,709,408 24,018,865 20,990,581
Operating Income (Loss) 1,672,187 1,878,342 2,238,683 2,270,375 (461,011)
% of Net Revenues 9.0% 8.9% 9.3% 8.6% -2.2%
Income (Loss) before Income Taxes and Equity in Earnings of Affiliated Companies 1,754,637 2,087,360 2,382,516 2,437,222 (560,381)
Provision for Income Taxes 657,910 795,153 898,312 911,495 (56,442)
Net Income (Loss) Attributable to Toyota Motor Corporation 1,171,260 1,372,180 1,644,032 1,717,879 (436,937)
ROE 13.6% 14.0% 14.7% 14.5% -4.0%
Net Cash Provided by Operating Activities 2,370,940 2,515,480 3,238,173 2,981,624 1,476,905
Net Cash Used in Investing Activities (3,061,196) (3,375,500) (3,814,378) (3,874,886) (1,230,220)
Net Cash Provided by (Used in) Financing Activities 419,384 876,911 881,768 706,189 698,841
R&D Expenses 755,147 812,648 890,782 958,882 904,075
Capital Expenditures for Property, Plant and Equipment* 1,068,287 1,523,459 1,425,814 1,480,570 1,364,582
Depreciation 997,713 1,211,178 1,382,594 1,491,135 1,495,170
At Year-End:
Toyota Motor Corporation Shareholders’ Equity 9,044,950 10,560,449 11,836,092 11,869,527 10,061,207
Total Assets 24,335,011 28,731,595 32,574,779 32,458,320 29,062,037
Long-Term Debt 5,014,925 5,640,490 6,263,585 5,981,931 6,301,469
Cash and Cash Equivalents 1,483,753 1,569,387 1,900,379 1,628,547 2,444,280
Ratio of Toyota Motor Corporation Shareholders’ Equity 37.2% 36.8% 36.3% 36.6% 34.6%
Yen
2005 2006 2007 2008 2009
Per Share Data:
Net Income (Loss) Attributable to Toyota Motor Corporation (Basic) 355.35 421.76 512.09 540.65 (139.13)
Annual Cash Dividends 65 90 120 140 100
Toyota Motor Corporation Shareholders’ Equity 2,767.67 3,257.63 3,701.17 3,768.97 3,208.41
Stock Information (March 31):
Stock Price 3,990 6,430 7,550 4,970 3,120
Market Capitalization (Yen in millions) 14,403,890 23,212,284 27,255,481 17,136,548 10,757,752
Number of Shares Issued (shares) 3,609,997,492 3,609,997,492 3,609,997,492 3,447,997,492 3,447,997,492
* Excluding vehicles and equipment of operating leases
Selected Financial Summary (U.S. GAAP)
Toyota Motor Corporation
Fiscal years ended March 31
Selected Financial Summary (U.S. GAAP) [1 of 2] Consolidated Segment Information Consolidated Quarterly Financial Summary Management’s Discussion and Analysis of Financial Condition and Results of Operations Consolidated Financial Statements