Walmart 2016 Annual Report Download - page 20
Download and view the complete annual report
Please find page 20 of the 2016 Walmart annual report below. You can navigate through the pages in the report by either clicking on the pages listed below, or by using the keyword search tool below to find specific information within the annual report.-
 1
1 -
2
-
3
-
4
-
5
-
6
-
7
-
8
-
9
-
 10
10 -
 11
11 -
 12
12 -
 13
13 -
 14
14 -
 15
15 -
 16
16 -
 17
17 -
 18
18 -
 19
19 -
 20
20 -
 21
21 -
 22
22 -
 23
23 -
 24
24 -
 25
25 -
 26
26 -
 27
27 -
 28
28 -
 29
29 -
 30
30 -
31
-
32
-
33
-
34
-
35
-
36
-
37
-
38
-
39
-
40
-
41
-
42
-
43
-
44
-
45
-
46
-
47
-
48
-
49
-
50
-
51
-
52
-
53
-
54
-
55
-
56
-
57
-
58
-
59
-
60
-
61
-
62
-
63
-
64
-
65
-
66
-
67
-
68
 |
 |

2016 Annual Report18
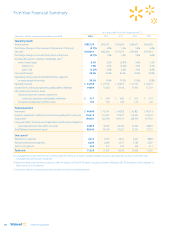
Five-Year Financial Summary
As of and for the Fiscal Years Ended January 31,
(Amounts in millions, except per share and unit count data) 2016 2015 2014 2013 2012
Operating results
Total revenues $482,130 $485,651 $476,294 $468,651 $446,509
Percentage change in total revenues from previous fiscal year (0.7)% 2.0% 1.6% 5.0% 6.0%
Net sales $478,614 $482,229 $473,076 $465,604 $443,416
Percentage change in net sales from previous fiscal year (0.7)% 1.9% 1.6% 5.0% 6.0%
Increase (decrease) in calendar comparable sales
(1)
in the United States 0.3% 0.5% (0.5)% 2.4% 1.6%
Walmart U.S. 1.0% 0.6% (0.6)% 2.0% 0.3%
Sam’s Club (3.2)% 0.0% 0.3% 4.1% 8.4%
Gross profit margin 24.6% 24.3% 24.3% 24.3% 24.5%
Operating, selling, general and administrative expenses,
as a percentage of net sales 20.3% 19.4% 19.3% 19.0% 19.2%
Operating income $ 24,105 $ 27,147 $ 26,872 $ 27,725 $ 26,491
Income from continuing operations attributable to Walmart 14,694 16,182 15,918 16,963 15,734
Net income per common share:
Diluted income per common share from
continuing operations attributable to Walmart $ 4.57 $ 4.99 $ 4.85 $ 5.01 $ 4.53
Dividends declared per common share 1.96 1.92 1.88 1.59 1.46
Financial position
Inventories $ 44,469 $ 45,141 $ 44,858 $ 43,803 $ 40,714
Property, equipment, capital lease and financing obligation assets, net 116,516 116,655 117,907 116,681 112,324
Total assets
(2)
199,581 203,490 204,541 202,910 193,120
Long-term debt
(2)
and long-term capital lease and financing obligations
(excluding amounts due within one year) 44,030 43,495 44,368 41,240 46,818
Total Walmart shareholders’ equity 80,546 81,394 76,255 76,343 71,315
Unit counts
(3)
Walmart U.S. segment 4,574 4,516 4,203 4,005 3,868
Walmart International segment 6,299 6,290 6,107 5,783 5,287
Sam’s Club segment 655 647 632 620 611
Total units 11,528 11,453 10,942 10,408 9,766
(1) Comparable sales include sales from stores and clubs open for the previous 12 months, including remodels, relocations and expansions, as well as e-commerce sales.
Comparable store and club sales include fuel.
(2) Total assets and long-term debt were adjusted to reflect the adoption of ASU 2015-03, Interest-Imputation of Interest (Subtopic 835-30): Simplifying the Presentation of
Debt Issuance Cost, for all periods.
(3) Unit counts related to discontinued operations have been removed from all relevant periods.