Walmart 2016 Annual Report Download - page 51
Download and view the complete annual report
Please find page 51 of the 2016 Walmart annual report below. You can navigate through the pages in the report by either clicking on the pages listed below, or by using the keyword search tool below to find specific information within the annual report.-
 1
1 -
2
-
3
-
4
-
5
-
6
-
7
-
8
-
9
-
10
-
11
-
12
-
13
-
14
-
15
-
16
-
17
-
18
-
19
-
20
-
21
-
22
-
23
-
24
-
25
-
26
-
27
-
28
-
29
-
30
-
31
-
32
-
33
-
34
-
35
-
36
-
37
-
38
-
39
-
40
-
 41
41 -
 42
42 -
 43
43 -
 44
44 -
 45
45 -
 46
46 -
 47
47 -
 48
48 -
 49
49 -
 50
50 -
 51
51 -
 52
52 -
 53
53 -
 54
54 -
 55
55 -
 56
56 -
 57
57 -
 58
58 -
 59
59 -
 60
60 -
 61
61 -
62
-
63
-
64
-
65
-
66
-
67
-
68
 |
 |

49Only Walmart
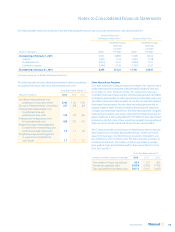
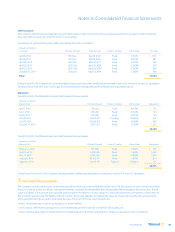
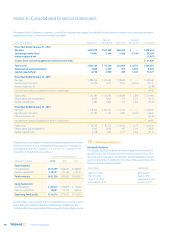
Debt Issuances
The Company did not have any material long-term debt issuances during fiscal 2016, but received proceeds from a number of small, immaterial
long-term debt issuances by several of its non-U.S. operations.
Information on significant long-term debt issued during fiscal 2015 is as follows:
(Amounts in millions)
Issue Date Principal Amount Maturity Date Fixed vs. Floating Interest Rate Proceeds
April 8, 2014 850 Euro April 8, 2022 Fixed 1.900% $ 1,161
April 8, 2014 650 Euro April 8, 2026 Fixed 2.550% 885
April 22, 2014 500 USD April 21, 2017 Fixed 1.000% 499
April 22, 2014 1,000 USD April 22, 2024 Fixed 3.300% 992
April 22, 2014 1,000 USD April 22, 2044 Fixed 4.300% 985
October 22, 2014 500 USD April 22, 2024 Fixed 3.300% 508
Total $5,030
During fiscal 2015, the Company also received additional proceeds from other, smaller long-term debt issuances by several of its non-U.S. operations.
The proceeds in fiscal 2015 were used to pay down and refinance existing debt and for other general corporate purposes.
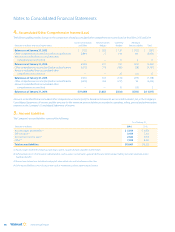
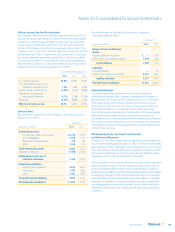
Maturities
During fiscal 2016, the following long-term debt matured and was repaid:
(Amounts in millions)
Maturity Date Principal Amount Fixed vs. Floating Interest Rate Repayment
April 1, 2015 750 USD Fixed 2.875% $ 750
July 1, 2015 750 USD Fixed 4.500% 750
July 8, 2015 750 USD Fixed 2.250% 750
July 28, 2015 30,000 JPY Floating Floating 243
July 28, 2015 60,000 JPY Fixed 0.940% 487
October 25, 2015 1,250 USD Fixed 1.500% 1,250
$4,230
During fiscal 2015, the following long-term debt matured and was repaid:
(Amounts in millions)
Maturity Date Principal Amount Fixed vs. Floating Interest Rate Repayment
February 3, 2014 500 USD Fixed 3.000% $ 500
April 15, 2014 1,000 USD Fixed 1.625% 1,000
May 15, 2014 1,000 USD Fixed 3.200% 1,000
August 6, 2014 83,100 JPY Fixed 1.490% 810
August 6, 2014 16,900 JPY Floating Floating 165
$3,475
During fiscal 2016 and 2015, the Company also repaid other, smaller long-term debt as it matured in several of its non-U.S. operations.
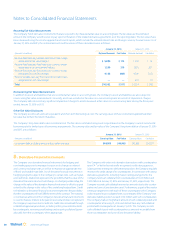
7. Fair Value Measurements
The Company records and discloses certain financial and non-financial assets and liabilities at fair value. The fair value of an asset is the price at which
the asset could be sold in an ordinary transaction between unrelated, knowledgeable and willing parties able to engage in the transaction. The fair
value of a liability is the amount that would be paid to transfer the liability to a new obligor in a transaction between such parties, not the amount
that would be paid to settle the liability with the creditor. Assets and liabilities recorded at fair value are measured using the fair value hierarchy,
which prioritizes the inputs used in measuring fair value. The levels of the fair value hierarchy are:
• Level 1: observable inputs such as quoted prices in active markets;
• Level 2: inputs other than quoted prices in active markets that are either directly or indirectly observable; and
• Level 3: unobservable inputs for which little or no market data exists, therefore requiring the Company to develop its own assumptions.
Notes to Consolidated Financial Statements