Walmart 2016 Annual Report Download - page 27
Download and view the complete annual report
Please find page 27 of the 2016 Walmart annual report below. You can navigate through the pages in the report by either clicking on the pages listed below, or by using the keyword search tool below to find specific information within the annual report.-
 1
1 -
2
-
3
-
4
-
5
-
6
-
7
-
8
-
9
-
10
-
11
-
12
-
13
-
14
-
15
-
16
-
 17
17 -
 18
18 -
 19
19 -
 20
20 -
 21
21 -
 22
22 -
 23
23 -
 24
24 -
 25
25 -
 26
26 -
 27
27 -
 28
28 -
 29
29 -
 30
30 -
 31
31 -
 32
32 -
 33
33 -
 34
34 -
 35
35 -
 36
36 -
 37
37 -
38
-
39
-
40
-
41
-
42
-
43
-
44
-
45
-
46
-
47
-
48
-
49
-
50
-
51
-
52
-
53
-
54
-
55
-
56
-
57
-
58
-
59
-
60
-
61
-
62
-
63
-
64
-
65
-
66
-
67
-
68
 |
 |

25Only Walmart
Management’s Discussion and Analysis of
Financial Condition and Results of Operations
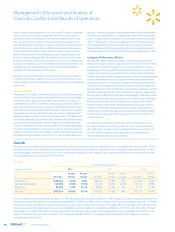
Sam’s Club Segment
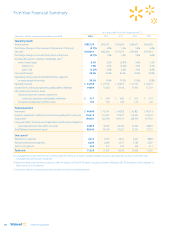
We believe the information in the following table under the caption
“Excluding Fuel” is useful to investors because it permits investors to
understand the effect of the Sam’s Club segment’s fuel sales on its
results of operations, which are impacted by the volatility of fuel prices.
Volatility in fuel prices may continue to impact the operating results of
the Sam’s Club segment in the future.
(Amounts in millions, Fiscal Years Ended January 31,
except unit counts) 2016 2015 2014
Including Fuel
Net sales $56,828 $58,020 $57,157
Percentage change from
comparable period (2.1)% 1.5% 1.3%
Calendar comparable club
sales increase (decrease) (3.2)% 0.0% 0.3%
Operating income $ 1,820 $ 1,976 $ 1,843
Operating income as a
percentage of net sales 3.2% 3.4% 3.2%
Unit counts at period end 655 647 632
Retail square feet at period end 88 87 84
Excluding Fuel
Net sales $52,330 $51,630 $50,574
Percentage change from
comparable period 1.4% 2.1% 1.6%
Operating income $ 1,746 $ 1,854 $ 1,817
Operating income as a
percentage of net sales 3.3% 3.6% 3.6%
Net sales for the Sam’s Club segment decreased 2.1% for fiscal 2016 and
increased 1.5% for fiscal 2015 when compared to the previous fiscal year.
The fiscal 2016 decrease in net sales was primarily due to declines in
comparable club sales, which were driven by a decrease of $1.9 billion
in fuel sales that resulted primarily from lower selling prices for fuel.
The decrease in net sales was partially offset by year-over-year growth in
retail square feet of 1.2% and higher e-commerce sales at samsclub.com.
The fiscal 2015 increase in net sales was primarily due to year-over-year
growth in retail square feet of 2.5%, driven by the addition of 15 new
clubs, partially offset by a decrease in fuel sales from lower fuel prices.
Comparable club sales were flat for fiscal 2015.
Gross profit rate increased 30 basis points for fiscal 2016 and decreased
12 basis points for fiscal 2015, when compared to the previous fiscal
year. For fiscal 2016, the increase was primarily due to the reduction in
low margin fuel sales and lower merchandise acquisition costs, partially
offset by the segment’s continued investment in the Cash Rewards
program. For fiscal 2015, the gross profit rate decreased primarily due
to the segment’s investment in the Cash Rewards program, changes in
merchandise mix, and commodity cost inflation, partially offset by an
increased gross profit rate on fuel sales.
Membership and other income increased 5.3% and 7.7% for fiscal 2016
and 2015, respectively, when compared to the previous fiscal year. For
fiscal 2016, the increase was primarily the result of increased member-
ship upgrades and Plus Member renewals. For fiscal 2015, the increase
was primarily the result of increased membership upgrades, Plus Member
renewals and an increase in members from the opening of 15 new clubs.
Operating expenses as a percentage of segment net sales increased
67 basis points for fiscal 2016 and decreased 16 basis points for fiscal 2015,
when compared to the previous fiscal year. For fiscal 2016, the increase in
operating expenses as a percentage of segment net sales was primarily
due to lower fuel sales, an increase in wage expense due to the new
associate wage structure, our continued investments in new clubs,
digital retail and information technology, and the approximately $60 mil-
lion charge for club closures announced in January 2016. For fiscal 2015,
the decrease in operating expenses as a percentage of segment net
sales was primarily due to better expense management in a number of
areas, including the optimization of the new in-club staffing structure
announced in fiscal 2014, which resulted in decreases in wage expense
and payroll taxes.
As a result of the factors discussed above, segment operating income
was $1.8 billion, $2.0 billion and $1.8 billion for fiscal 2016, 2015 and
2014, respectively.
Liquidity and Capital Resources
Liquidity
The strength and stability of our operations have historically supplied us
with a significant source of liquidity. Our cash flows provided by operating
activities, supplemented with our long-term debt and short-term
borrowings, have been sufficient to fund our operations while allowing us
to invest in activities that support the long-term growth of our operations.
Generally, some or all of the remaining available cash flow has been
used to fund the dividends on our common stock and share repurchases.
We believe our sources of liquidity will continue to be adequate to fund
operations, finance our global expansion activities, pay dividends and
fund our share repurchases for the foreseeable future.
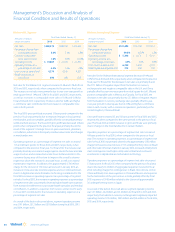
Net Cash Provided by Operating Activities
Fiscal Years Ended January 31,
(Amounts in millions) 2016 2015 2014
Net cash provided by
operating activities $27,389 $28,564 $23,257
Net cash provided by operating activities was $27.4 billion, $28.6 billion
and $23.3 billion for fiscal 2016, 2015 and 2014, respectively. The decrease in
net cash provided by operating activities for fiscal 2016, when compared
to the previous fiscal year, was primarily due to lower income from
continuing operations, partially offset by improved working capital
management. The increase in net cash provided by operating activities
for fiscal 2015, when compared to the previous fiscal year, was primarily
due to the timing of payments for accounts payable and accrued liabilities,
as well as the timing of income tax payments.
In fiscal 2017, the Company will move forward with the second year of our
new associate wage structure combined with comprehensive associate
training and educational programs which was announced in fiscal 2016.
We anticipate cash flows provided by operating activities will be sufficient
to fund these programs in fiscal 2017 and future years.