Walmart 2016 Annual Report Download - page 23
Download and view the complete annual report
Please find page 23 of the 2016 Walmart annual report below. You can navigate through the pages in the report by either clicking on the pages listed below, or by using the keyword search tool below to find specific information within the annual report.-
 1
1 -
2
-
3
-
4
-
5
-
6
-
7
-
8
-
9
-
10
-
11
-
12
-
 13
13 -
 14
14 -
 15
15 -
 16
16 -
 17
17 -
 18
18 -
 19
19 -
 20
20 -
 21
21 -
 22
22 -
 23
23 -
 24
24 -
 25
25 -
 26
26 -
 27
27 -
 28
28 -
 29
29 -
 30
30 -
 31
31 -
 32
32 -
 33
33 -
34
-
35
-
36
-
37
-
38
-
39
-
40
-
41
-
42
-
43
-
44
-
45
-
46
-
47
-
48
-
49
-
50
-
51
-
52
-
53
-
54
-
55
-
56
-
57
-
58
-
59
-
60
-
61
-
62
-
63
-
64
-
65
-
66
-
67
-
68
 |
 |

21Only Walmart
Management’s Discussion and Analysis of
Financial Condition and Results of Operations
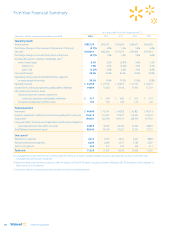
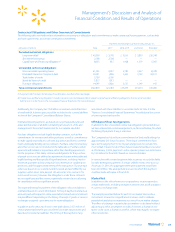
Calendar Comparable Store and Club Sales
Comparable store and club sales is a metric which indicates the performance of our existing U.S. stores and clubs by measuring the change in sales
for such stores and clubs, including e-commerce sales, for a particular period over the corresponding period in the previous year. The retail industry
generally reports comparable store and club sales using the retail calendar (also known as the 4-5-4 calendar). To be consistent with the retail industry,
we provide comparable store and club sales using the retail calendar in our quarterly earnings releases. However, when we discuss our comparable
store and club sales below, we are referring to our calendar comparable store and club sales calculated using our fiscal calendar. As our fiscal calendar
differs from the retail calendar, our fiscal calendar comparable store and club sales also differ from the retail calendar comparable store and club
sales provided in our quarterly earnings releases. Calendar comparable store and club sales, as well as the impact of fuel, for fiscal 2016 and 2015,
were as follows:
Fiscal Years Ended January 31,
2016 2015 2016 2015
With Fuel Fuel Impact
Walmart U.S. 1.0% 0.6% 0.0% 0.0%
Sam’s Club (3.2)% 0.0% (3.4)% (0.6)%
Total U.S. 0.3% 0.5% (0.6)% (0.1)%
Comparable store and club sales in the U.S., including fuel, increased
0.3% and 0.5% in fiscal 2016 and 2015, respectively, when compared to
the previous fiscal year. The fiscal 2016 total U.S. comparable store and
club sales were positively impacted by continued traffic improvement
and higher e-commerce sales at the Walmart U.S. segment, offset to a
significant degree by the negative impact of lower fuel sales primarily
due to lower fuel prices at the Sam’s Club segment. E-commerce sales
positively impacted comparable sales approximately 0.2% and 0.6% for
Walmart U.S. and Sam’s Club, respectively, for fiscal 2016. The fiscal 2015
total U.S. comparable store and club sales were positively impacted by
higher traffic during the end of the fiscal year. E-commerce sales positively
impacted comparable sales approximately 0.3% and 0.2% for Walmart
U.S. and Sam’s Club, respectively, for fiscal 2015.
As we continue to add new stores and clubs in the U.S., we do so with an
understanding that additional stores and clubs may take sales away from
existing units. We estimate the negative impact on comparable store and
club sales as a result of opening new stores and clubs was approximately
0.8% and 0.9% in fiscal 2016 and 2015, respectively. Our estimate is calcu-
lated primarily by comparing the sales trends of the impacted stores and
clubs, which are identified based on their proximity to the new stores
and clubs, to those of nearby non-impacted stores and clubs, in each
case, as measured after the new stores and clubs are opened.
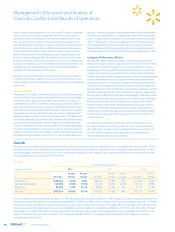
Strategic Growth Investments
During fiscal 2016, we made capital investments globally of $11.5 billion.
These capital investments primarily consisted of payments to add new
stores and clubs, remodel existing stores and clubs, construct distribution
centers and invest in technology. In addition, we made an incremental
operational investment of $296 million in e-commerce in fiscal 2016 as
compared to fiscal 2015. We also made operational investments of
approximately $1.2 billion in fiscal 2016 in connection with the new
associate wage structure and comprehensive associate training and
educational programs announced in first quarter of fiscal 2016. These
operational investments will continue into the year ending January 31,
2017 (“fiscal 2017”).
Returns
While we are focused primarily on growth, we also place a priority on
generating returns to ensure our approach is appropriately balanced.
We generate returns by efficiently deploying assets and effectively
managing working capital. We monitor these efforts through our return
on investment and free cash flow metrics, which we discuss below. In
addition, we are focused on providing returns to our shareholders in
the form of share repurchases and dividends, which are discussed in the
Liquidity and Capital Resources section.
Return on Investment
Management believes return on investment (“ROI”) is a meaningful
metric to share with investors because it helps investors assess how
effectively Walmart is deploying its assets. Trends in ROI can fluctuate
over time as management balances long-term potential strategic
initiatives with possible short-term impacts.
ROI was 15.5% and 16.9% for the fiscal years ended January 31, 2016 and
2015, respectively. The decline in ROI was primarily due to our decrease
in operating income, as well as continued capital investments.
We define ROI as adjusted operating income (operating income plus
interest income, depreciation and amortization, and rent expense) for the
fiscal year divided by average invested capital during that period. We
consider average invested capital to be the average of our beginning and
ending total assets, plus average accumulated depreciation and average
accumulated amortization, less average accounts payable and average
accrued liabilities for that period, plus a rent factor equal to the rent for
the fiscal year multiplied by a factor of eight. When we have discontinued
operations, we exclude the impact of the discontinued operations.
Our calculation of ROI is considered a non-GAAP financial measure because
we calculate ROI using financial measures that exclude and include amounts
that are included and excluded in the most directly comparable financial
measure calculated and presented in accordance with generally accepted
accounting principles in the U.S. (“GAAP”). For example, we exclude the impact
of depreciation and amortization from our reported operating income in
calculating the numerator of our calculation of ROI. In addition, we include