Walmart 2016 Annual Report Download - page 21
Download and view the complete annual report
Please find page 21 of the 2016 Walmart annual report below. You can navigate through the pages in the report by either clicking on the pages listed below, or by using the keyword search tool below to find specific information within the annual report.-
 1
1 -
2
-
3
-
4
-
5
-
6
-
7
-
8
-
9
-
10
-
 11
11 -
 12
12 -
 13
13 -
 14
14 -
 15
15 -
 16
16 -
 17
17 -
 18
18 -
 19
19 -
 20
20 -
 21
21 -
 22
22 -
 23
23 -
 24
24 -
 25
25 -
 26
26 -
 27
27 -
 28
28 -
 29
29 -
 30
30 -
 31
31 -
32
-
33
-
34
-
35
-
36
-
37
-
38
-
39
-
40
-
41
-
42
-
43
-
44
-
45
-
46
-
47
-
48
-
49
-
50
-
51
-
52
-
53
-
54
-
55
-
56
-
57
-
58
-
59
-
60
-
61
-
62
-
63
-
64
-
65
-
66
-
67
-
68
 |
 |

19Only Walmart
Management’s Discussion and Analysis of
Financial Condition and Results of Operations
Overview
Wal-Mart Stores, Inc. (“Walmart,” the “Company” or “we”) is engaged in
retail and wholesale operations in various formats around the world.
Through our operations, we help people around the world save money
and live better – anytime and anywhere – in retail stores or through our
e-commerce and mobile capabilities. Through innovation, we are striving
to create a customer-centric experience that seamlessly integrates digital
and physical shopping. Physical retail encompasses our brick and mortar
presence in each of the markets in which we operate. Digital retail is
comprised of our e-commerce websites and mobile commerce applica-
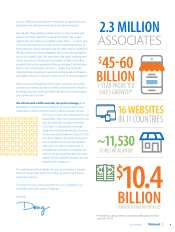
tions. Each week, we serve nearly 260 million customers who visit our
over 11,500 stores under 63 banners in 28 countries and e-commerce
websites in 11 countries. Our strategy is to lead on price, invest to differ-
entiate on access, be competitive on assortment and deliver a great
experience. By leading on price we earn the trust of our customers every
day by providing a broad assortment of quality merchandise and services
at everyday low prices (“EDLP”). EDLP is our pricing philosophy under
which we price items at a low price every day so our customers trust
that our prices will not change under frequent promotional activity.
Price leadership is core to who we are. Everyday low cost (“EDLC”) is
our commitment to control expenses so those cost savings can be
passed along to our customers. Our digital and physical presence, which
we are investing in to integrate, provides customers access to our broad
assortment anytime and anywhere. We strive to give our customers
and members a great digital and physical shopping experience.
Our operations consist of three reportable segments: Walmart U.S.,
Walmart International and Sam’s Club.
• Walmart U.S. is our largest segment with three primary store formats,
as well as digital retail. Of our three reportable segments, Walmart U.S.
has historically had the highest gross profit as a percentage of net
sales (“gross profit rate”). In addition, it has historically contributed the
greatest amount to the Company’s net sales and operating income.
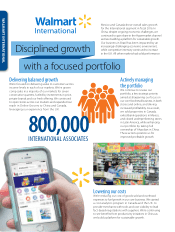
• Walmart International consists of our operations outside of the U.S.
and includes retail, wholesale and other businesses. These businesses
consist of numerous formats, including supercenters, supermarkets,
hypermarkets, warehouse clubs, including Sam’s Clubs, cash & carry,
home improvement, specialty electronics, apparel stores, drug stores
and convenience stores, as well as digital retail. The overall gross
profit rate for Walmart International is lower than that of Walmart U.S.
because of its merchandise mix. Walmart International is our second
largest segment and has grown through acquisitions, as well as by
adding retail, wholesale and other units, and expanding digital retail.
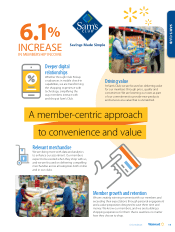
• Sam’s Club consists of membership-only warehouse clubs as well as
digital retail. As a membership-only warehouse club, membership
income is a significant component of the segment’s operating income.
Sam’s Club operates with a lower gross profit rate and lower operating
expenses as a percentage of net sales than our other segments.
Each of our segments contributes to the Company’s operating results
differently, but each has generally maintained a consistent contribution
rate to the Company’s net sales and operating income in recent years.
Our fiscal year ends on January 31 for our U.S. and Canadian operations.
We consolidate all other operations generally using a one-month lag and
on a calendar year basis. Our business is seasonal to a certain extent due
to calendar events and national and religious holidays, as well as weather
patterns. Historically, our highest sales volume and operating income
have occurred in the fiscal quarter ending January 31.
This discussion, which presents our results for periods occurring in the
fiscal years ended January 31, 2016 (“fiscal 2016”), January 31, 2015 (“fiscal
2015”) and January 31, 2014 (“fiscal 2014”) should be read in conjunction
with our Consolidated Financial Statements and the accompanying notes.
We intend for this discussion to provide the reader with information
that will assist in understanding our financial statements, the changes in
certain key items in those financial statements from period to period and
the primary factors that accounted for those changes. We also discuss
certain performance metrics that management uses to assess the
Company’s performance. Additionally, the discussion provides informa-
tion about the financial results of the three segments of our business
to provide a better understanding of how each of those segments and
its results of operations affect the financial condition and results of
operations of the Company as a whole.
Throughout this Management’s Discussion and Analysis of Financial
Condition and Results of Operations, we discuss segment operating
income, comparable store and club sales and other measures.
Management measures the results of the Company’s segments using
each segment’s operating income, including certain corporate overhead
allocations, as well as other measures. From time to time, we revise the
measurement of each segment’s operating income, including certain
corporate overhead allocations, and other measures as determined by
the information regularly reviewed by our chief operating decision
maker. When we do so, the previous period amounts and balances are
reclassified to conform to the current period’s presentation.
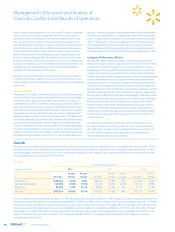
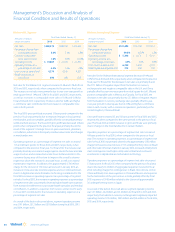
Comparable store and club sales is a metric that indicates the performance
of our existing U.S. stores and clubs by measuring the change in sales
for such stores and clubs, including e-commerce sales, for a particular
period from the corresponding period in the previous year. Walmart’s
definition of comparable store and club sales includes sales from stores and
clubs open for the previous 12 months, including remodels, relocations,
expansions and conversions, as well as e-commerce sales. We measure
the e-commerce sales impact by including those sales initiated through
our websites and our mobile commerce applications and fulfilled
through our e-commerce distribution facilities, as well as an estimate
for sales initiated online and on our mobile commerce applications,
but fulfilled through our stores and clubs. Sales of a store that has changed
in format are excluded from comparable store and club sales when the
conversion of that store is accompanied by a relocation or expansion
that results in a change in the store’s retail square feet of more than five
percent. Comparable store and club sales are also referred to as “same-
store” sales by others within the retail industry. The method of calculating
comparable store and club sales varies across the retail industry. As a
result, our calculation of comparable store and club sales is not necessarily
comparable to similarly titled measures reported by other companies.