Walmart 2016 Annual Report Download - page 26
Download and view the complete annual report
Please find page 26 of the 2016 Walmart annual report below. You can navigate through the pages in the report by either clicking on the pages listed below, or by using the keyword search tool below to find specific information within the annual report.-
 1
1 -
2
-
3
-
4
-
5
-
6
-
7
-
8
-
9
-
10
-
11
-
12
-
13
-
14
-
15
-
 16
16 -
 17
17 -
 18
18 -
 19
19 -
 20
20 -
 21
21 -
 22
22 -
 23
23 -
 24
24 -
 25
25 -
 26
26 -
 27
27 -
 28
28 -
 29
29 -
 30
30 -
 31
31 -
 32
32 -
 33
33 -
 34
34 -
 35
35 -
 36
36 -
37
-
38
-
39
-
40
-
41
-
42
-
43
-
44
-
45
-
46
-
47
-
48
-
49
-
50
-
51
-
52
-
53
-
54
-
55
-
56
-
57
-
58
-
59
-
60
-
61
-
62
-
63
-
64
-
65
-
66
-
67
-
68
 |
 |

2016 Annual Report24
Management’s Discussion and Analysis of
Financial Condition and Results of Operations
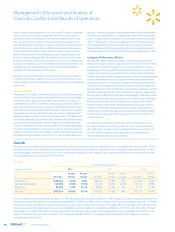
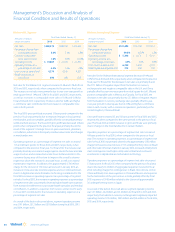
Walmart U.S. Segment
(Amounts in millions, Fiscal Years Ended January 31,
except unit counts) 2016 2015 2014
Net sales $298,378 $288,049 $279,406
Percentage change from
comparable period 3.6% 3.1% 1.8%
Calendar comparable
store sales increase 1.0% 0.6% (0.6)%
Operating income $ 19,087 $ 21,336 $ 21,787
Operating income as a
percentage of net sales 6.4% 7.4% 7.8%
Unit counts at period end 4,574 4,516 4,203
Retail square feet at
period end 690 680 659
Net sales for the Walmart U.S. segment increased 3.6% and 3.1% for fiscal
2016 and 2015, respectively, when compared to the previous fiscal year.
The increases in net sales were primarily due to year-over-year growth in
retail square feet of 1.4% and 3.2% for fiscal 2016 and 2015, respectively,
as well as increases in comparable store sales of 1.0% and 0.6% for
fiscal 2016 and 2015, respectively. Positive customer traffic and higher
e-commerce sales contributed to the increases in comparable store
sales in both periods.
The fiscal 2016 gross profit rate increased 12 basis points compared to the
previous fiscal year, primarily due to improved margin in food, general
merchandise, and consumables, partially offset by continued pharmacy
reimbursement pressure. The fiscal 2015 gross profit rate decreased 12 basis
points when compared to the previous fiscal year, primarily due to the
result of the segment’s strategic focus on price investment, pharmacy
cost inflation, reductions in third-party reimbursement rates and changes
in merchandise mix.
Operating expenses as a percentage of segment net sales increased
113 and 24 basis points for fiscal 2016 and 2015, respectively, when
compared to the previous fiscal year. For fiscal 2016, the increase was
primarily driven by an increase in wage expense due to the new associate
wage structure and increased associate hours. Enhancements to the
customer-facing areas of the store to improve the overall customer
experience drove the increase in associate hours as well as increased
maintenance expenses. In addition, the approximately $700 million
charge for the closures of 150 stores announced in January 2016, an
increase in store associate incentive expense and our continued invest-
ments in digital retail and information technology contributed to the
fiscal 2016 increase in operating expenses as a percentage of segment
net sales. For fiscal 2015, the increase in operating expenses as a percentage
of segment net sales was primarily driven by higher health-care expenses
from increased enrollment in our associate health-care plans and medical
cost inflation. In addition, expenses from severe winter storms early
in fiscal 2015 contributed to the increase in operating expenses as a
percentage of segment net sales.
As a result of the factors discussed above, segment operating income
was $19.1 billion, $21.3 billion and $21.8 billion during fiscal 2016, 2015
and 2014, respectively.
Walmart International Segment
(Amounts in millions, Fiscal Years Ended January 31,
except unit counts) 2016 2015 2014
Net sales $123,408 $136,160 $136,513
Percentage change from
comparable period (9.4)% (0.3)% 1.3%
Operating income $ 5,346 $ 6,171 $ 5,153
Operating income as a
percentage of net sales 4.3% 4.5% 3.8%
Unit counts at period end 6,299 6,290 6,107
Retail square feet at period end 372 368 358
Net sales for the Walmart International segment decreased 9.4% and
0.3% for fiscal 2016 and 2015, respectively, when compared to the previous
fiscal year. For fiscal 2016, the decrease in net sales was primarily due to
the $17.1 billion of negative impact from fluctuations in currency
exchange rates and negative comparable sales in the U.K. and China,
partially offset by year-over-year growth in retail square feet of 1.2% and
positive comparable sales in Mexico and Canada. For fiscal 2015, the
decrease in net sales was primarily due to $5.3 billion of negative impact
from fluctuations in currency exchange rates, partially offset by year-
over-year growth in retail square feet of 2.6% and higher e-commerce
sales in each country with e-commerce operations, particularly in the
United Kingdom, China and Brazil.
Gross profit rate increased 23 and 12 basis points for fiscal 2016 and 2015,
respectively, when compared to the same periods in the previous fiscal
year. The fiscal 2016 and 2015 increases in gross profit rate were primarily
due to changes in the merchandise mix in certain markets.
Operating expenses as a percentage of segment net sales increased
44 basis points for fiscal 2016, when compared to the previous fiscal
year. The increase in operating expenses as a percentage of segment net
sales for fiscal 2016 was primarily driven by the approximately $150 million
charge for the announced closure of 115 underperforming stores in Brazil
and other Latin American markets in January 2016, increased employment
claim contingencies and higher utility rates in Brazil and continued
investments in digital retail and information technology.
Operating expenses as a percentage of segment net sales decreased
51 basis points for fiscal 2015 when compared to the previous fiscal year
due to the nearly $1.0 billion of aggregated expenses incurred in fiscal
2014, including charges for contingencies in Brazil, store closure costs in
China and Brazil, store lease expenses in China and Mexico and expenses
for the termination of the joint venture in India, partially offset by fiscal
2015 expenses of $148 million related to the closure of approximately
30 underperforming stores in Japan.
As a result of the factors discussed above, segment operating income
was $5.3 billion, $6.2 billion and $5.2 billion for fiscal 2016, 2015 and 2014,
respectively. Fluctuations in currency exchange rates negatively impacted
operating income $765 million, $225 million and $26 million in fiscal 2016,
2015 and 2014, respectively.