Walmart 2016 Annual Report Download - page 54
Download and view the complete annual report
Please find page 54 of the 2016 Walmart annual report below. You can navigate through the pages in the report by either clicking on the pages listed below, or by using the keyword search tool below to find specific information within the annual report.-
 1
1 -
2
-
3
-
4
-
5
-
6
-
7
-
8
-
9
-
10
-
11
-
12
-
13
-
14
-
15
-
16
-
17
-
18
-
19
-
20
-
21
-
22
-
23
-
24
-
25
-
26
-
27
-
28
-
29
-
30
-
31
-
32
-
33
-
34
-
35
-
36
-
37
-
38
-
39
-
40
-
41
-
42
-
43
-
 44
44 -
 45
45 -
 46
46 -
 47
47 -
 48
48 -
 49
49 -
 50
50 -
 51
51 -
 52
52 -
 53
53 -
 54
54 -
 55
55 -
 56
56 -
 57
57 -
 58
58 -
 59
59 -
 60
60 -
 61
61 -
 62
62 -
 63
63 -
 64
64 -
65
-
66
-
67
-
68
 |
 |

2016 Annual Report52
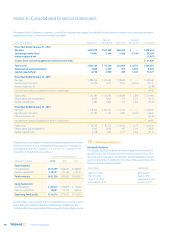
Financial Statement Presentation
Although subject to master netting arrangements, the Company does not offset derivative assets and derivative liabilities in its Consolidated Balance
Sheets. Derivative instruments with an unrealized gain are recorded in the Company’s Consolidated Balance Sheets as either current or non-current
assets, based on maturity date, and those hedging instruments with an unrealized loss are recorded as either current or non-current liabilities, based
on maturity date. Refer to Note 7 for the net presentation of the Company’s derivative instruments.
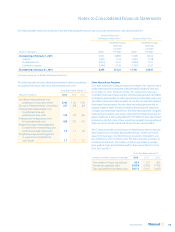
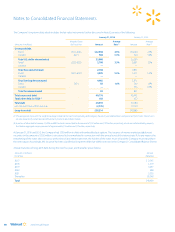
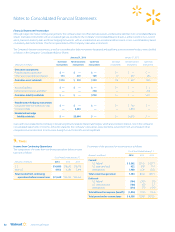
The Company’s derivative instruments, as well as its nonderivative debt instruments designated and qualifying as net investment hedges, were classified
as follows in the Company’s Consolidated Balance Sheets:
January 31, 2016 January 31, 2015
Fair Value Net Investment Cash Flow Fair Value Net Investment Cash Flow
(Amounts in millions) Instruments Instruments Instruments Instruments Instruments Instruments
Derivative instruments
Prepaid expenses and other $ — $ — $ — $— $ — $ —
Other assets and deferred charges 173 319 129 12 207 293
Derivative asset subtotals $173 $ 319 $129 $12 $ 207 $293
Accrued liabilities $ — $ — $ — $— $ — $ 1
Deferred income taxes and other — — 738 — — 610
Derivative liability subtotals $ — $ — $738 $— $ — $611
Nonderivative hedging instruments
Long-term debt due within one year $ — $ — $ — $— $ 766 $ —
Long-term debt — 3,644 — — 3,850 —
Nonderivative hedge
liability subtotals $ — $3,644 $ — $— $4,616 $ —
Gains and losses related to the Company’s derivatives primarily relate to interest rate hedges, which are recorded in interest, net, in the Company’s
Consolidated Statements of Income. Amounts related to the Company’s derivatives expected to be reclassified from accumulated other
comprehensive income (loss) to net income during the next 12 months are not significant.
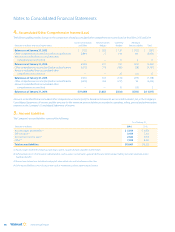
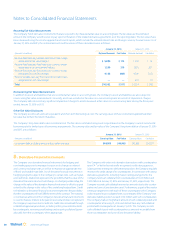
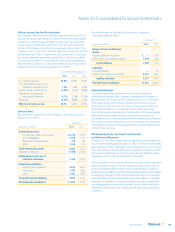
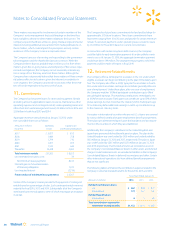
9. Taxes
Income from Continuing Operations
The components of income from continuing operations before income
taxes are as follows:
Fiscal Years Ended January 31,
(Amounts in millions) 2016 2015 2014
U.S. $16,685 $18,610 $19,412
Non-U.S. 4,953 6,189 5,244
Total income from continuing
operations before income taxes $21,638 $24,799 $24,656
A summary of the provision for income taxes is as follows:
Fiscal Years Ended January 31,
(Amounts in millions) 2016 2015 2014
Current:
U.S. federal $ 5,562 $6,165 $6,377
U.S. state and local 622 810 719
International 1,400 1,529 1,523
Total current tax provision 7,584 8,504 8,619
Deferred:
U.S. federal (704) (387) (72)
U.S. state and local (106) (55) 37
International (216) (77) (479)
Total deferred tax expense (benefit) (1,026) (519) (514)
Total provision for income taxes $ 6,558 $7,985 $8,105
Notes to Consolidated Financial Statements