Walmart 2016 Annual Report Download - page 47
Download and view the complete annual report
Please find page 47 of the 2016 Walmart annual report below. You can navigate through the pages in the report by either clicking on the pages listed below, or by using the keyword search tool below to find specific information within the annual report.-
 1
1 -
2
-
3
-
4
-
5
-
6
-
7
-
8
-
9
-
10
-
11
-
12
-
13
-
14
-
15
-
16
-
17
-
18
-
19
-
20
-
21
-
22
-
23
-
24
-
25
-
26
-
27
-
28
-
29
-
30
-
31
-
32
-
33
-
34
-
35
-
36
-
 37
37 -
 38
38 -
 39
39 -
 40
40 -
 41
41 -
 42
42 -
 43
43 -
 44
44 -
 45
45 -
 46
46 -
 47
47 -
 48
48 -
 49
49 -
 50
50 -
 51
51 -
 52
52 -
 53
53 -
 54
54 -
 55
55 -
 56
56 -
 57
57 -
58
-
59
-
60
-
61
-
62
-
63
-
64
-
65
-
66
-
67
-
68
 |
 |

45Only Walmart
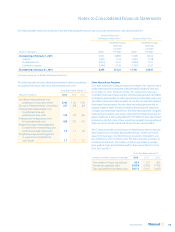
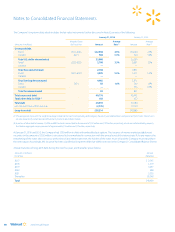
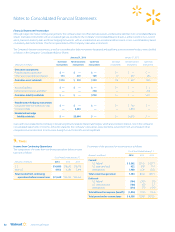
The following table shows the activity for restricted stock and performance share units and restricted stock units during fiscal 2016:
Restricted Stock and
Performance Share Units
(1)
Restricted Stock Units
Weighted-Average Weighted-Average
Grant-Date Grant-Date
Fair Value Fair Value
(Shares in thousands) Shares Per Share Shares Per Share
Outstanding at February 1, 2015 8,723 $68.89 17,568 $61.00
Granted 3,295 71.64 6,392 71.38
Vested/exercised (2,313) 61.37 (4,444) 53.71
Forfeited or expired (1,446) 67.90 (1,925) 66.37
Outstanding at January 31, 2016 8,259 $72.23 17,591 $65.67
(1) Assumes payout rate at 100% for Performance Share Units.
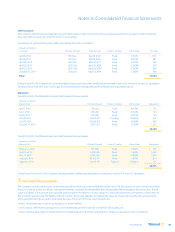
The following table includes additional information related to restricted
stock and performance share units and restricted stock units:
Fiscal Years Ended January 31,
(Amounts in millions) 2016 2015 2014
Fair value of restricted stock and
performance share units vested $142 $156 $116
Fair value of restricted stock units vested 237 218 189
Unrecognized compensation cost
for restricted stock and
performance share units 133 154 200
Unrecognized compensation cost
for restricted stock units 628 570 497
Weighted average remaining period
to expense for restricted stock and
performance share units (years) 1.3 1.3 2.0
Weighted average remaining period
to expense for restricted stock
units (years) 1.7 1.7 2.1
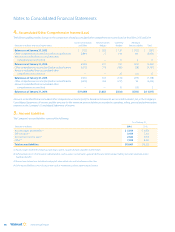
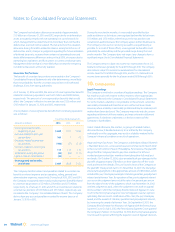
Share Repurchase Program
From time to time, the Company repurchases shares of its common stock
under share repurchase programs authorized by the Board of Directors.
On October 13, 2015, the Board of Directors replaced the previous
$15.0 billion share repurchase program, which had approximately $8.6 billion
of remaining authorization for share repurchases as of that date, with a new
$20.0 billion share repurchase program. As was the case with the replaced
share repurchase program, the new share repurchase program has no
expiration date or other restrictions limiting the period over which the
Company can make share repurchases. The share repurchases the Company
made during fiscal 2016 were made under both the old and new authori-
zations. At January 31, 2016, authorization for $17.5 billion of share repurchases
remained under the current share repurchase program. Any repurchased
shares are constructively retired and returned to an unissued status.
The Company considers several factors in determining when to execute
share repurchases, including, among other things, current cash needs,
capacity for leverage, cost of borrowings, its results of operations and
the market price of its common stock. The following table provides, on
a settlement date basis, the number of shares repurchased, average
price paid per share and total cash paid for share repurchases for fiscal
2016, 2015 and 2014:
Fiscal Years Ended January 31,
(Amounts in millions, except per share data) 2016 2015 2014
Total number of shares repurchased 62.4 13.4 89.1
Average price paid per share $65.90 $75.82 $74.99
Total cash paid for share repurchases $4,112 $1,015 $6,683
Notes to Consolidated Financial Statements