Walmart 2016 Annual Report Download - page 60
Download and view the complete annual report
Please find page 60 of the 2016 Walmart annual report below. You can navigate through the pages in the report by either clicking on the pages listed below, or by using the keyword search tool below to find specific information within the annual report.-
 1
1 -
2
-
3
-
4
-
5
-
6
-
7
-
8
-
9
-
10
-
11
-
12
-
13
-
14
-
15
-
16
-
17
-
18
-
19
-
20
-
21
-
22
-
23
-
24
-
25
-
26
-
27
-
28
-
29
-
30
-
31
-
32
-
33
-
34
-
35
-
36
-
37
-
38
-
39
-
40
-
41
-
42
-
43
-
44
-
45
-
46
-
47
-
48
-
49
-
 50
50 -
 51
51 -
 52
52 -
 53
53 -
 54
54 -
 55
55 -
 56
56 -
 57
57 -
 58
58 -
 59
59 -
 60
60 -
 61
61 -
 62
62 -
 63
63 -
 64
64 -
 65
65 -
 66
66 -
 67
67 -
 68
68
 |
 |

2016 Annual Report58
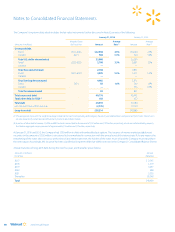
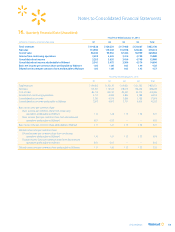
Information for the Company’s segments, as well as for Corporate and support, including the reconciliation to income from continuing operations
before income taxes, is provided in the following table:
Walmart Corporate
(Amounts in millions) Walmart U.S. International Sam’s Club and support Consolidated
Fiscal Year Ended January 31, 2016
Net sales $298,378 $123,408 $56,828 $ — $478,614
Operating income (loss) 19,087 5,346 1,820 (2,148) 24,105
Interest expense, net (2,467)
Income from continuing operations before income taxes $ 21,638
Total assets $103,109 $ 73,720 $13,998 $ 8,754 $199,581
Depreciation and amortization 2,800 2,549 472 3,633 9,454
Capital expenditures 6,728 2,930 695 1,124 11,477
Fiscal Year Ended January 31, 2015
Net sales $ 288,049 $ 136,160 $ 58,020 $ — $ 482,229
Operating income (loss) 21,336 6,171 1,976 (2,336) 27,147
Interest expense, net (2,348)
Income from continuing operations before income taxes $ 24,799
Total assets $ 101,381 $ 80,505 $ 13,995 $ 7,609 $ 203,490
Depreciation and amortization 2,665 2,665 473 3,370 9,173
Capital expenditures 6,286 3,936 753 1,199 12,174
Fiscal Year Ended January 31, 2014
Net sales $ 279,406 $ 136,513 $ 57,157 $ — $ 473,076
Operating income (loss) 21,787 5,153 1,843 (1,911) 26,872
Interest expense, net (2,216)
Income from continuing operations before income taxes $ 24,656
Total assets $ 98,745 $ 85,370 $ 14,053 $ 6,373 $ 204,541
Depreciation and amortization 2,640 2,658 437 3,135 8,870
Capital expenditures 6,378 4,463 1,071 1,203 13,115
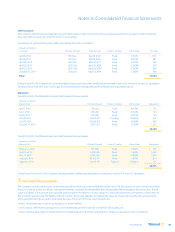
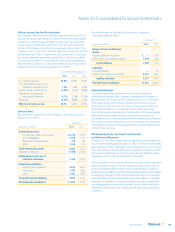
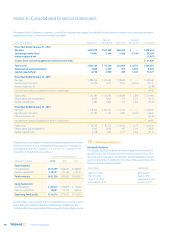
Total revenues, consisting of net sales and membership and other income,
and long-lived assets, consisting primarily of property and equipment,
net, aggregated by the Company’s U.S. and non-U.S. operations for
fiscal 2016, 2015 and 2014, are as follows:
Fiscal Years Ended January 31,
(Amounts in millions) 2016 2015 2014
Total revenues
U.S. operations $357,559 $348,227 $338,681
Non-U.S. operations 124,571 137,424 137,613
Total revenues $482,130 $485,651 $476,294
Long-lived assets
U.S. operations $ 82,475 $ 80,879 $ 79,644
Non-U.S. operations 34,041 35,776 38,263
Total long-lived assets $116,516 $116,655 $117,907
No individual country outside of the U.S. had total revenues or long-lived
assets that were material to the consolidated totals. Additionally, the
Company did not generate material total revenues from any single customer.
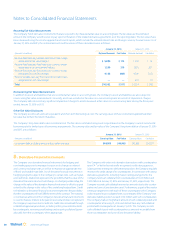
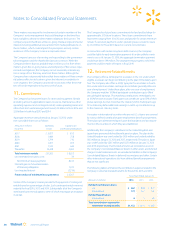
15. Subsequent Event
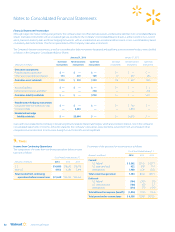
Dividends Declared
On February 18, 2016, the Board of Directors approved the fiscal 2017
annual dividend at $2.00 per share, an increase over the fiscal 2016
dividend of $1.96 per share. For fiscal 2017, the annual dividend will be
paid in four quarterly installments of $0.50 per share, according to the
following record and payable dates:
Record Date Payable Date
March 11, 2016 April 4, 2016
May 13, 2016 June 6, 2016
August 12, 2016 September 6, 2016
December 9, 2016 January 3, 2017
Notes to Consolidated Financial Statements