Walmart 2016 Annual Report Download - page 22
Download and view the complete annual report
Please find page 22 of the 2016 Walmart annual report below. You can navigate through the pages in the report by either clicking on the pages listed below, or by using the keyword search tool below to find specific information within the annual report.-
 1
1 -
2
-
3
-
4
-
5
-
6
-
7
-
8
-
9
-
10
-
11
-
 12
12 -
 13
13 -
 14
14 -
 15
15 -
 16
16 -
 17
17 -
 18
18 -
 19
19 -
 20
20 -
 21
21 -
 22
22 -
 23
23 -
 24
24 -
 25
25 -
 26
26 -
 27
27 -
 28
28 -
 29
29 -
 30
30 -
 31
31 -
 32
32 -
33
-
34
-
35
-
36
-
37
-
38
-
39
-
40
-
41
-
42
-
43
-
44
-
45
-
46
-
47
-
48
-
49
-
50
-
51
-
52
-
53
-
54
-
55
-
56
-
57
-
58
-
59
-
60
-
61
-
62
-
63
-
64
-
65
-
66
-
67
-
68
 |
 |

2016 Annual Report20
Management’s Discussion and Analysis of
Financial Condition and Results of Operations
In discussing our operating results, we use the term “currency exchange
rates” to refer to the currency exchange rates we use to convert the
operating results for all countries where the functional currency is not
the U.S. dollar into U.S. dollars for financial reporting purposes. We
calculate the effect of changes in currency exchange rates from the prior
period to the current period as the difference between current period
activity translated using the current period’s currency exchange rates,
and current period activity translated using the comparable prior year
period’s currency exchange rates. Throughout our discussion, we refer
to the results of this calculation as the impact of currency exchange rate
fluctuations. Volatility in currency exchange rates may impact the results,
including net sales and operating income, of the Company and the
Walmart International segment in the future.
We made certain reclassifications to prior period amounts or balances
to conform to the presentation in the current fiscal year. These reclassi-
fications did not impact the Company’s operating income or consolidated
net income.
The Retail Industry
We operate in the highly competitive retail industry in all of the markets
we serve. We face strong sales competition from other discount, depart-
ment, drug, dollar, variety and specialty stores, warehouse clubs and
supermarkets, as well as e-commerce and catalog businesses. Many of
these competitors are national, regional or international chains or have
a national or international online presence. We compete with a number
of companies for prime retail site locations, as well as in attracting and
retaining quality employees (whom we call “associates”). We, along with
other retail companies, are influenced by a number of factors including,
but not limited to: catastrophic events, weather, competitive pressures,
consumer disposable income, consumer debt levels and buying patterns,
consumer credit availability, cost of goods, currency exchange rate fluc-
tuations, customer preferences, deflation, inflation, fuel and energy prices,
general economic conditions, insurance costs, interest rates, labor costs,
tax rates, cybersecurity attacks and unemployment. Further information
on the factors that can affect our operating results and on certain risks
to our Company and an investment in its securities can be found under
“Item 1A. Risk Factors” in our Annual Report on Form 10-K for the fiscal
year ended January 31, 2016, and in the discussion under “Cautionary
Statement Regarding Forward-Looking Statements and Information” in
our Annual Report on Form 10-K for the fiscal year ended January 31, 2016.
Company Performance Metrics
We are committed to helping customers save money and live better
through everyday low prices, supported by everyday low costs. At times,
we adjust our business strategies to ensure we maintain our strong
leadership position around the world and in the countries in which we
operate. For several years, our performance metrics emphasized three
financial priorities: growth, leverage and returns. We are currently making
strategic investments in our associates and in the integration of digital
and physical retail. These investments support long-term growth while
we maintain our heritage of everyday low prices which are supported
by everyday low cost. During this time of increased investments, we have
shifted our financial priorities to focus primarily on growth, balanced by
the long-term health of the Company including returns. We will continue
to grow through new stores and clubs, and through increasing compara-
ble store and club sales, which include our e-commerce sales. While
leverage remains important to everyday low cost, during this time of
increased investments, operating expenses may grow at a rate that is
greater than or equal to the rate of our net sales growth, and operating
income may grow at a rate that is equal to or less than the rate of our
net sales growth.
Our objective of balancing growth with returns means that we are
focused on efficiently employing assets for return on investment and
more effectively managing working capital to deliver strong free cash
flow. We will also continue to provide returns to our shareholders
through share repurchases and dividends.
Growth
We measure our growth primarily by the amount of the period-over-period growth in our net sales and our comparable store and club sales. We also
review the progress of our digital retail investments by measuring the impact e-commerce sales have on our comparable store and club sales. At times,
we make strategic investments which are focused on the long-term growth of the Company. These strategic investments may not benefit net sales
and comparable store and club sales in the near term.
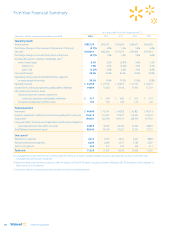
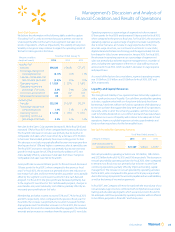
Net Sales
Fiscal Years Ended January 31,
(Amounts in millions) 2016 2015 2014
Percent Percent Percent Percent Percent
Net Sales of Total Change Net Sales of Total Change Net Sales of Total
Walmart U.S. $298,378 62.3% 3.6% $288,049 59.8% 3.1% $279,406 59.0%
Walmart International 123,408 25.8% (9.4)% 136,160 28.2% (0.3)% 136,513 28.9%
Sam’s Club 56,828 11.9% (2.1)% 58,020 12.0% 1.5% 57,157 12.1%
Net sales $478,614 100.0% (0.7)% $482,229 100.0% 1.9% $473,076 100.0%
Our consolidated net sales decreased $3.6 billion or 0.7% for fiscal 2016 and increased $9.2 billion or 1.9% for fiscal 2015, when compared to the previous
fiscal year. Net sales for fiscal 2016 were negatively impacted by $17.1 billion or 3.5% as a result of fluctuations in currency exchange rates and a $1.9 billion
decrease in fuel sales primarily due to the lower selling prices of fuel at our Sam’s Club segment. The negative effect of such factors was offset by 1.3%
year-over-year growth in retail square feet, positive comparable sales in the Walmart U.S. segment and higher e-commerce sales across the Company.
The increase in net sales for fiscal 2015 was primarily due to 3.0% year-over-year growth in retail square feet, positive comparable sales in the U.S. and
higher e-commerce sales across the Company. The increase was partially offset by $5.3 billion of negative impact from fluctuations in currency
exchange rates for fiscal 2015.