Walmart 2016 Annual Report Download - page 24
Download and view the complete annual report
Please find page 24 of the 2016 Walmart annual report below. You can navigate through the pages in the report by either clicking on the pages listed below, or by using the keyword search tool below to find specific information within the annual report.-
 1
1 -
2
-
3
-
4
-
5
-
6
-
7
-
8
-
9
-
10
-
11
-
12
-
13
-
 14
14 -
 15
15 -
 16
16 -
 17
17 -
 18
18 -
 19
19 -
 20
20 -
 21
21 -
 22
22 -
 23
23 -
 24
24 -
 25
25 -
 26
26 -
 27
27 -
 28
28 -
 29
29 -
 30
30 -
 31
31 -
 32
32 -
 33
33 -
 34
34 -
35
-
36
-
37
-
38
-
39
-
40
-
41
-
42
-
43
-
44
-
45
-
46
-
47
-
48
-
49
-
50
-
51
-
52
-
53
-
54
-
55
-
56
-
57
-
58
-
59
-
60
-
61
-
62
-
63
-
64
-
65
-
66
-
67
-
68
 |
 |

2016 Annual Report22
Management’s Discussion and Analysis of
Financial Condition and Results of Operations
a factor of eight for rent expense that estimates the hypothetical capitalization
of our operating leases. We consider return on assets (“ROA”) to be the
financial measure computed in accordance with GAAP that is the most
directly comparable financial measure to our calculation of ROI. ROI differs
from ROA (which is consolidated income from continuing operations for the
period divided by average total assets of continuing operations for the
period) because ROI: adjusts operating income to exclude certain expense
items and adds interest income; adjusts total assets of continuing opera-
tions for the impact of accumulated depreciation and amortization,
accounts payable and accrued liabilities; and incorporates a factor of rent to
arrive at total invested capital. Because of the adjustments mentioned
above, we believe ROI more accurately measures how we are deploying
our key assets and is more meaningful to investors than ROA.
Although ROI is a standard financial metric, numerous methods exist for
calculating a company’s ROI. As a result, the method used by management
to calculate our ROI may differ from the methods used by other companies
to calculate their ROI.
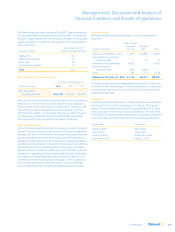
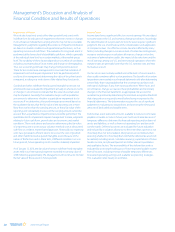
The calculation of ROI, along with a reconciliation to the calculation of
ROA, the most comparable GAAP financial measure, is as follows:
Fiscal Years
Ended January 31,
(Amounts in millions) 2016 2015
CALCULATION OF RETURN ON INVESTMENT
Numerator
Operating income $ 24,105 $ 27,147
+ Interest income 81 113
+ Depreciation and amortization 9,454 9,173
+ Rent 2,532 2,777
= Adjusted operating income $ 36,172 $ 39,210
Denominator
Average total assets of
continuing operations
(1)
$201,536 $203,786
+ Average accumulated depreciation
and amortization
(1)
68,759 63,375
- Average accounts payable
(1)
38,449 37,913
- Average accrued liabilities
(1)
19,380 18,973
+ Rent x 8 20,256 22,216
= Average invested capital $232,722 $232,491
Return on investment (ROI) 15.5% 16.9%
CALCULATION OF RETURN ON ASSETS
Numerator
Income from continuing operations $ 15,080 $ 16,814
Denominator
Average total assets of
continuing operations
(1)
$201,536 $203,786
Return on assets (ROA) 7.5% 8.2%
As of January 31,
2016 2015 2014
Certain Balance Sheet Data
Total assets of
continuing operations
(2)
$199,581 $203,490 $204,081
Accumulated depreciation
and amortization 71,538 65,979 60,771
Accounts payable 38,487 38,410 37,415
Accrued liabilities 19,607 19,152 18,793
(1) The average is based on the addition of the account balance at the end of the current
period to the account balance at the end of the prior period and dividing by 2.
(2) Total assets of continuing operations were adjusted to reflect the adoption of
ASU 2015- 03, Interest-Imputation of Interest (Subtopic 835-30): Simplifying
the Presentation of Debt Issuance Cost, for all periods.
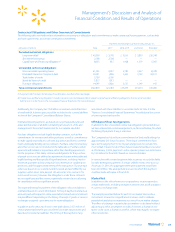
Free Cash Flow
Free cash flow is considered a non-GAAP financial measure. Management
believes, however, that free cash flow, which measures our ability to
generate additional cash from our business operations, is an important
financial measure for use in evaluating the Company’s financial perfor-
mance. Free cash flow should be considered in addition to, rather than
as a substitute for, consolidated income from continuing operations
as a measure of our performance and net cash provided by operating
activities as a measure of our liquidity.
We define free cash flow as net cash provided by operating activities
in a period minus payments for property and equipment made in that
period. We generated free cash flow of $15.9 billion, $16.4 billion and
$10.1 billion for fiscal 2016, 2015 and 2014, respectively. The decrease in
free cash flow in fiscal 2016 from fiscal 2015 was primarily due to lower
income from continuing operations, partially offset by lower capital
spending and improved working capital management.
Walmart’s definition of free cash flow is limited in that it does not
represent residual cash flows available for discretionary expenditures due
to the fact that the measure does not deduct the payments required for
debt service and other contractual obligations or payments made for
business acquisitions. Therefore, we believe it is important to view free
cash flow as a measure that provides supplemental information to our
Consolidated Statements of Cash Flows.
Although other companies report their free cash flow, numerous methods
may exist for calculating a company’s free cash flow. As a result, the
method used by Walmart’s management to calculate our free cash flow
may differ from the methods used by other companies to calculate their
free cash flow.