Walmart 2016 Annual Report Download - page 25
Download and view the complete annual report
Please find page 25 of the 2016 Walmart annual report below. You can navigate through the pages in the report by either clicking on the pages listed below, or by using the keyword search tool below to find specific information within the annual report.-
 1
1 -
2
-
3
-
4
-
5
-
6
-
7
-
8
-
9
-
10
-
11
-
12
-
13
-
14
-
 15
15 -
 16
16 -
 17
17 -
 18
18 -
 19
19 -
 20
20 -
 21
21 -
 22
22 -
 23
23 -
 24
24 -
 25
25 -
 26
26 -
 27
27 -
 28
28 -
 29
29 -
 30
30 -
 31
31 -
 32
32 -
 33
33 -
 34
34 -
 35
35 -
36
-
37
-
38
-
39
-
40
-
41
-
42
-
43
-
44
-
45
-
46
-
47
-
48
-
49
-
50
-
51
-
52
-
53
-
54
-
55
-
56
-
57
-
58
-
59
-
60
-
61
-
62
-
63
-
64
-
65
-
66
-
67
-
68
 |
 |

23Only Walmart
Management’s Discussion and Analysis of
Financial Condition and Results of Operations
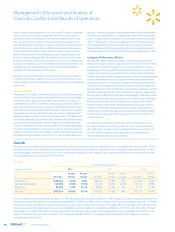
The following table sets forth a reconciliation of free cash flow, a
non-GAAP financial measure, to net cash provided by operating activities,
which we believe to be the GAAP financial measure most directly
comparable to free cash flow, as well as information regarding net cash
used in investing activities and net cash used in financing activities.
Fiscal Years Ended January 31,
(Amounts in millions) 2016 2015 2014
Net cash provided by
operating activities $ 27,389 $ 28,564 $ 23,257
Payments for property
and equipment (11,477) (12,174) (13,115)
Free cash flow $ 15,912 $ 16,390 $ 10,142
Net cash used in
investing activities
(1)
$(10,675) $(11,125) $(12,526)
Net cash used in
financing activities (16,122) (15,071) (10,789)
(1) “Net cash used in investing activities” includes payments for property and equipment,
which is also included in our computation of free cash flow.
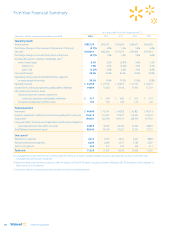
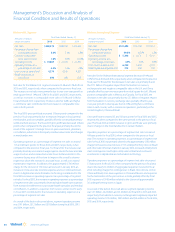
Results of Operations
Consolidated Results of Operations
(Amounts in millions, Fiscal Years Ended January 31,
except unit counts) 2016 2015 2014
Total revenues $482,130 $485,651 $476,294
Percentage change from
comparable period (0.7)% 2.0% 1.6%
Net sales $478,614 $482,229 $473,076
Percentage change from
comparable period (0.7)% 1.9% 1.6%
Total U.S. calendar comparable
store and club sales
increase (decrease) 0.3% 0.5% (0.5)%
Gross profit rate 24.6% 24.3% 24.3%
Operating income $ 24,105 $ 27,147 $ 26,872
Operating income as a
percentage of net sales 5.0% 5.6% 5.7%
Income from continuing
operations $ 15,080 $ 16,814 $ 16,551
Unit counts at period end 11,528 11,453 10,942
Retail square feet at period end 1,149 1,135 1,101
Our total revenues, which are mostly comprised of net sales, but also
include membership and other income, decreased 0.7% for fiscal 2016
and increased 2.0% for fiscal 2015 when compared to the previous fiscal
year. Net sales decreased 0.7% for fiscal 2016 and increased 1.9% for fiscal
2015 when compared to the previous fiscal year. For fiscal 2016, net sales
were negatively impacted by $17.1 billion as a result of fluctuations in
currency exchange rates and a decrease of $1.9 billion in fuel sales that
resulted primarily from lower selling prices for fuel at our Sam’s Club
segment. The negative effect of such factors on our consolidated net sales
was partially offset by the 1.3% year-over-year growth in retail square
feet, positive comparable sales in the Walmart U.S. segment and higher
e-commerce sales across the Company. For fiscal 2015, the increase in net
sales was primarily due to 3.0% year-over-year growth in retail square feet,
positive comparable sales in the U.S. and higher e-commerce sales across
the Company. The increase was partially offset by $5.3 billion of negative
impact from fluctuations in currency exchange rates for fiscal 2015.
Our gross profit rate increased 29 basis points for fiscal 2016 when
compared to fiscal 2015. Improved margins in food, general merchandise,
and consumables in the Walmart U.S. segment positively impacted our
gross profit rate. Changes in the merchandise mix in the Walmart
International segment and a reduction in low margin fuel sales in the
Sam’s Club segment also positively impacted our gross profit rate,
while continued pharmacy reimbursement pressure at the Walmart U.S.
segment negatively impacted our gross profit rate. Our gross profit rate
was relatively flat in fiscal 2015 when compared to fiscal 2014.
Operating expenses as a percentage of net sales increased 91 and 6 basis
points for fiscal 2016 and 2015, respectively, when compared to the
previous fiscal year. For fiscal 2016, the increase in operating expenses
as a percentage of net sales was primarily due to an increase in wage
expense at the Walmart U.S. segment due to the new associate wage
structure and increased associate hours to improve the overall customer
experience, the approximately $0.9 billion charge for the store closures
announced in January 2016 and our continued investments in digital
retail and information technology. For fiscal 2015, the increase in operating
expenses as a percentage of net sales was due to our continued
investments in digital retail and higher health-care expenses in the
U.S. from increased enrollment in our associate health-care plans and
medical cost inflation, the $249 million impact of wage and hour litigation
in the U.S., as well as expenses of $148 million related to the closure of
approximately 30 underperforming stores in Japan. The impact of these
factors in the increase of operating expenses as a percentage of net sales
for fiscal 2015 was partially offset by nearly $1.0 billion of aggregated
expenses incurred in fiscal 2014.
Our effective income tax rate was 30.3%, 32.2% and 32.9% for fiscal 2016,
2015 and 2014, respectively. Our effective tax rate fluctuates from period
to period and may be impacted by a number of factors, including changes
in our assessment of certain tax contingencies, valuation allowances,
changes in laws, outcomes of administrative audits, the impacts of discrete
items and the mix of earnings among our U.S. and international operations.
The reconciliation from the U.S. statutory rate to the effective income tax
rates for fiscal 2016, 2015 and 2014 is presented in Note 9 in the “Notes to
Consolidated Financial Statements.”
As a result of the factors discussed above, we reported $15.1 billion,
$16.8 billion and $16.6 billion of consolidated income from continuing
operations for fiscal 2016, 2015 and 2014, respectively; a decrease of
$1.7 billion for fiscal 2016 and an increase of $263 million for fiscal 2015
when compared to the previous fiscal year. Diluted income from con-
tinuing operations per common share attributable to Walmart (“EPS”)
was $4.57, $4.99 and $4.85 for fiscal 2016, 2015 and 2014, respectively.