Walmart 2016 Annual Report Download - page 28
Download and view the complete annual report
Please find page 28 of the 2016 Walmart annual report below. You can navigate through the pages in the report by either clicking on the pages listed below, or by using the keyword search tool below to find specific information within the annual report.-
 1
1 -
2
-
3
-
4
-
5
-
6
-
7
-
8
-
9
-
10
-
11
-
12
-
13
-
14
-
15
-
16
-
17
-
 18
18 -
 19
19 -
 20
20 -
 21
21 -
 22
22 -
 23
23 -
 24
24 -
 25
25 -
 26
26 -
 27
27 -
 28
28 -
 29
29 -
 30
30 -
 31
31 -
 32
32 -
 33
33 -
 34
34 -
 35
35 -
 36
36 -
 37
37 -
 38
38 -
39
-
40
-
41
-
42
-
43
-
44
-
45
-
46
-
47
-
48
-
49
-
50
-
51
-
52
-
53
-
54
-
55
-
56
-
57
-
58
-
59
-
60
-
61
-
62
-
63
-
64
-
65
-
66
-
67
-
68
 |
 |

2016 Annual Report26
Management’s Discussion and Analysis of
Financial Condition and Results of Operations
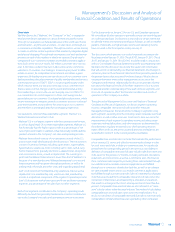
Cash Equivalents and Working Capital
Cash and cash equivalents were $8.7 billion and $9.1 billion at January 31,
2016 and 2015, respectively. Our working capital deficit was $4.4 billion
and $2.0 billion at January 31, 2016 and 2015, respectively. The increase in
our working capital deficit reflects the Company’s efficient leverage
achieved through improved working capital management, in addition
to the timing of payments. We generally operate with a working capital
deficit due to our efficient use of cash in funding operations, consistent
access to the capital markets and in providing returns to our shareholders
in the form of payments of cash dividends and share repurchases.
We use intercompany financing arrangements in an effort to ensure
cash can be made available in the country in which it is needed with
the minimum cost possible. We do not believe it will be necessary to
repatriate earnings held outside of the U.S. and anticipate our domestic
liquidity needs will be met through cash flows provided by operating
activities, supplemented with long-term debt and short-term borrowings.
Accordingly, we intend, with only certain exceptions, to continue to
indefinitely reinvest our earnings held outside of the U.S. in our foreign
operations. When the income earned, either from operations or through
intercompany financing arrangements, and indefinitely reinvested outside
of the U.S. is taxed at local country tax rates, which are generally lower
than the U.S. statutory rate, we realize an effective tax rate benefit. If our
intentions with respect to reinvestment were to change, most of the
amounts held within our foreign operations could be repatriated to the
U.S., although any repatriation under current U.S. tax laws would be
subject to U.S. federal income taxes, less applicable foreign tax credits.
We do not expect local laws, other limitations or potential taxes on
anticipated future repatriations of earnings held outside of the U.S. to
have a material effect on our overall liquidity, financial condition or
results of operations.
As of January 31, 2016 and January 31, 2015, cash and cash equivalents of
approximately $1.1 billion and $1.7 billion, respectively, may not be freely
transferable to the U.S. due to local laws or other restrictions.
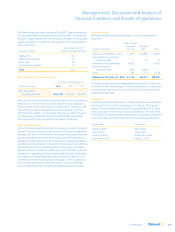
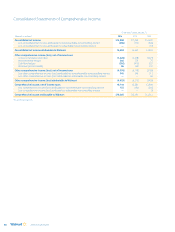
Net Cash Used in Investing Activities
As of January 31,
(Amounts in millions) 2016 2015 2014
Net cash used in
investing activities $(10,675) $(11,125) $(12,526)
Net cash used in investing activities was $10.7 billion, $11.1 billion and
$12.5 billion for fiscal 2016, 2015 and 2014, respectively, and generally
consisted of payments to add stores and clubs, remodel existing stores
and clubs, expand our digital retail capabilities and invest in other tech-
nologies. For fiscal 2016, we opened 423 new stores and clubs. Net cash
used in investing activities decreased $450 million and $1.4 billion for
fiscal 2016 and 2015, respectively, when compared to the previous fiscal
year, primarily due to lower capital expenditures. The following table
provides additional capital expenditure detail:
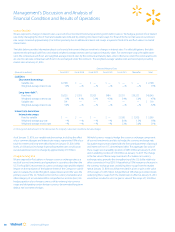
Allocation of Capital Expenditures
(Amounts in millions) Fiscal Years Ending January 31,
Capital Expenditures 2016 2015
New stores and clubs, including
expansions and relocations $ 3,194 $ 4,128
Information systems, distribution,
digital retail and other 3,963 3,288
Remodels 1,390 822
Total U.S. 8,547 8,238
Walmart International 2,930 3,936
Total capital expenditures $11,477 $12,174
Cash proceeds of $671 million received from the sale of the Vips restaurant
business in Mexico (“Vips”) on May 12, 2014, which is further described in
Note 13 to our Consolidated Financial Statements, also reduced net cash
used in investing activities in fiscal 2015.
We continued to focus on seamlessly integrating the digital and physical
shopping experience for our customers and expanding in digital retail in
each of our segments during fiscal 2016. Some of our fiscal 2016 accom-
plishments in this area were to successfully launch “Walmart Pay,” grow
integrated mobile applications and services including “Online Grocery”
and “Pickup Today,” continue to roll out our new web platform in the U.S.
and open new e-commerce dedicated fulfillment centers.
Growth Activities
In fiscal 2017, we plan to add between 342 and 405 new stores and clubs,
which will include a continued investment in Neighborhood Markets
and a moderation of Supercenter growth in the U.S. compared to recent
fiscal years. In addition, we plan to continue the growth of our digital
retail capabilities by investing approximately $1.1 billion in e-commerce
websites and mobile commerce applications that will include technology,
infrastructure and other elements of our e-commerce operations to
better serve our customers and support our stores and clubs. We antici-
pate financing these growth activities through cash flows provided by
operating activities and future debt financings.