Walmart 2016 Annual Report Download - page 29
Download and view the complete annual report
Please find page 29 of the 2016 Walmart annual report below. You can navigate through the pages in the report by either clicking on the pages listed below, or by using the keyword search tool below to find specific information within the annual report.-
 1
1 -
2
-
3
-
4
-
5
-
6
-
7
-
8
-
9
-
10
-
11
-
12
-
13
-
14
-
15
-
16
-
17
-
18
-
 19
19 -
 20
20 -
 21
21 -
 22
22 -
 23
23 -
 24
24 -
 25
25 -
 26
26 -
 27
27 -
 28
28 -
 29
29 -
 30
30 -
 31
31 -
 32
32 -
 33
33 -
 34
34 -
 35
35 -
 36
36 -
 37
37 -
 38
38 -
 39
39 -
40
-
41
-
42
-
43
-
44
-
45
-
46
-
47
-
48
-
49
-
50
-
51
-
52
-
53
-
54
-
55
-
56
-
57
-
58
-
59
-
60
-
61
-
62
-
63
-
64
-
65
-
66
-
67
-
68
 |
 |

27Only Walmart
Management’s Discussion and Analysis of
Financial Condition and Results of Operations
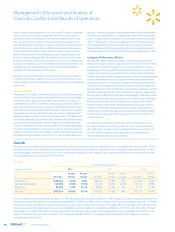
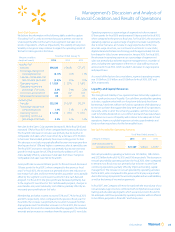
The following table provides our projected fiscal 2017 capital expenditures.
Our anticipated digital retail expenditures are included in our projected
fiscal 2017 capital expenditures. The amounts in the table do not include
capital expenditures or growth in retail square feet from any pending or
future acquisitions.
Approximate Fiscal 2017
(Amounts in billions) Projected Capital Expenditures
Walmart U.S. $ 6.2
Walmart International 3.0
Sam’s Club 0.8
Corporate and support 1.0
Total $11.0
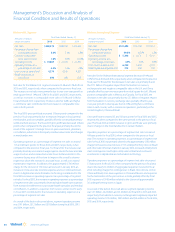
Net Cash Used in Financing Activities
Fiscal Years Ended January 31,
(Amounts in millions) 2016 2015 2014
Net cash used in
financing activities $(16,122) $(15,071) $(10,789)
Net cash flows used in financing activities generally consist of transactions
related to our short-term and long-term debt, financing obligations,
dividends paid and the repurchase of Company stock. Transactions with
noncontrolling interest shareholders are also classified as cash flows
from financing activities. Net cash used in financing activities increased
$1.1 billion and $4.3 billion for fiscal 2016 and fiscal 2015, respectively,
when compared to the same period in the previous fiscal year.
Short-term Borrowings
Net cash flows provided by short-term borrowings increased $1.2 billion
in fiscal 2016 and decreased $6.3 billion in fiscal 2015, when compared to
the balance at the end of the previous fiscal year. We generally utilize the
liquidity provided by short-term borrowings to provide funding for our
operations, dividend payments, share repurchases, capital expenditures
and other cash requirements. For fiscal 2016, the increase in net cash flows
provided by short-term borrowings partially offset a larger $2.0 billion
decrease in long-term debt due within one year. For fiscal 2015, more cash
provided from operating activities combined with less cash used for share
repurchases and capital expenditures during fiscal 2015 allowed us to
minimize our short-term borrowings as of January 31, 2015. In addition to
our short-term borrowings, we also have various undrawn committed
lines of credit that provide $15.0 billion of additional liquidity, if needed.
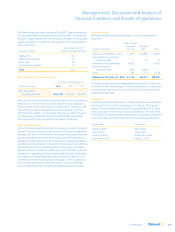
Long-term Debt
The following table provides the changes in our long-term debt for
fiscal 2016:
Long-term debt
due within Long-term
(Amounts in millions) one year debt Total
Balances as of February 1, 2015 $ 4,791 $ 40,889 $ 45,680
Proceeds from issuance of
long-term debt — 39 39
Payments of long-term debt (4,432) — (4,432)
Reclassifications of
long-term debt 2,000 (2,000) —
Other 386 (714) (328)
Balances as of January 31, 2016 $ 2,745 $38,214 $40,959
Our total outstanding long-term debt balance decreased $4.7 billion for
the twelve months ended January 31, 2016, primarily due to no significant
new long-term debt issuances in the current year offset by maturities of
existing long-term debt.
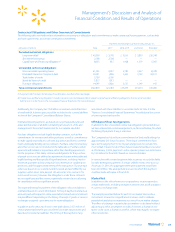
Dividends
Our total dividend payments were $6.3 billion, $6.2 billion and $6.1 billion
for fiscal 2016, 2015 and 2014, respectively. On February 18, 2016, the
Board of Directors approved the fiscal 2017 annual dividend of $2.00 per
share, an increase over the fiscal 2016 annual dividend of $1.96 per share.
For fiscal 2017, the annual dividend will be paid in four quarterly installments
of $0.50 per share, according to the following record and payable dates:
Record Date Payable Date
March 11, 2016 April 4, 2016
May 13, 2016 June 6, 2016
August 12, 2016 September 6, 2016
December 9, 2016 January 3, 2017