Walmart 2016 Annual Report Download - page 32
Download and view the complete annual report
Please find page 32 of the 2016 Walmart annual report below. You can navigate through the pages in the report by either clicking on the pages listed below, or by using the keyword search tool below to find specific information within the annual report.-
 1
1 -
2
-
3
-
4
-
5
-
6
-
7
-
8
-
9
-
10
-
11
-
12
-
13
-
14
-
15
-
16
-
17
-
18
-
19
-
20
-
21
-
 22
22 -
 23
23 -
 24
24 -
 25
25 -
 26
26 -
 27
27 -
 28
28 -
 29
29 -
 30
30 -
 31
31 -
 32
32 -
 33
33 -
 34
34 -
 35
35 -
 36
36 -
 37
37 -
 38
38 -
 39
39 -
 40
40 -
 41
41 -
 42
42 -
43
-
44
-
45
-
46
-
47
-
48
-
49
-
50
-
51
-
52
-
53
-
54
-
55
-
56
-
57
-
58
-
59
-
60
-
61
-
62
-
63
-
64
-
65
-
66
-
67
-
68
 |
 |

2016 Annual Report30
Management’s Discussion and Analysis of
Financial Condition and Results of Operations
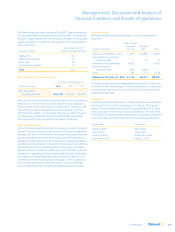
Interest Rate Risk
We are exposed to changes in interest rates as a result of our short-term borrowings and long-term debt issuances. We hedge a portion of our interest
rate risk by managing the mix of fixed and variable rate debt and by entering into interest rate swaps. For fiscal 2016, the net fair value of our interest
rate swaps increased approximately $162 million primarily due to additional interest rate swaps acquired in fiscal 2016 and fluctuations in market
interest rates.
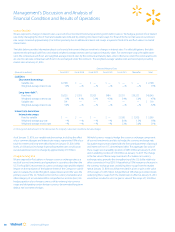
The table below provides information about our financial instruments that are sensitive to changes in interest rates. For debt obligations, the table
represents the principal cash flows and related weighted-average interest rates by expected maturity dates. For interest rate swaps, the table repre-
sents the contractual cash flows and weighted-average interest rates by the contractual maturity date, unless otherwise noted. The notional amounts
are used to calculate contractual cash flows to be exchanged under the contracts. The weighted-average variable rates are based upon prevailing
market rates at January 31, 2016.
Expected Maturity Date
(Amounts in millions) Fiscal 2017 Fiscal 2018 Fiscal 2019 Fiscal 2020 Fiscal 2021 Thereafter Total
Liabilities
Short-term borrowings:
Variable rate $2,708 $ — $ — $ — $ — $ — $ 2,708
Weighted-average interest rate 1.5% —% —% —% —% —% 1.5%
Long-term debt
(1)
:
Fixed rate $2,032 $1,518 $3,502 $484 $3,351 $29,353 $40,240
Weighted-average interest rate 1.9% 4.1% 3.1% 4.3% 3.4% 5.0% 4.5%
Variable rate 719 — — — — — $ 719
Weighted-average interest rate 5.2% —% —% —% —% —% 5.2%
Interest rate derivatives
Interest rate swaps:
Fixed to variable $ — $ — $ — $ — $1,500 $ 3,500 $ 5,000
Weighted-average pay rate —% —% —% —% 2.0% 1.5% 1.6%
Weighted-average receive rate —% —% —% —% 3.3% 3.0% 3.1%
(1) The long-term debt amounts in the table exclude the Company’s derivatives classified as fair value hedges.
As of January 31, 2016, our variable rate borrowings, including the effect
of our commercial paper and interest rate swaps, represented 19% of our
total short-term and long-term debt. Based on January 31, 2016 debt
levels, a 100 basis point change in prevailing market rates would cause
our annual interest costs to change by approximately $79 million.
Foreign Currency Risk
We are exposed to fluctuations in foreign currency exchange rates as a
result of our net investments and operations in countries other than the
U.S. For fiscal 2016, movements in currency exchange rates and the related
impact on the translation of the balance sheets of the Company’s subsid-
iaries in Canada, the United Kingdom, Japan, Mexico and Chile were the
primary cause of the $4.7 billion net loss in the currency translation and
other category of accumulated other comprehensive income (loss). We
hedge a portion of our foreign currency risk by entering into currency
swaps and designating certain foreign-currency-denominated long-term
debt as net investment hedges.
We hold currency swaps to hedge the currency exchange component
of our net investments and also to hedge the currency exchange rate
fluctuation exposure associated with the forecasted payments of principal
and interest of non-U.S. denominated debt. The aggregate fair value of
these swaps was in a liability position of $290 million at January 31, 2016
and in a liability position of $110 million at January 31, 2015. The change
in the fair value of these swaps was due to fluctuations in currency
exchange rates, primarily the strengthening of the U.S. dollar relative to
other currencies in fiscal 2016. A hypothetical 10% increase or decrease in
the currency exchange rates underlying these swaps from the market
rate at January 31, 2016 would have resulted in a loss or gain in the value
of the swaps of $445 million. A hypothetical 10% change in interest rates
underlying these swaps from the market rates in effect at January 31, 2016
would have resulted in a loss or gain in value of the swaps of $14 million.