Windstream 2011 Annual Report Download - page 114
Download and view the complete annual report
Please find page 114 of the 2011 Windstream annual report below. You can navigate through the pages in the report by either clicking on the pages listed below, or by using the keyword search tool below to find specific information within the annual report.-
 1
1 -
2
-
3
-
4
-
5
-
6
-
7
-
8
-
9
-
10
-
11
-
12
-
13
-
14
-
15
-
16
-
17
-
18
-
19
-
20
-
21
-
22
-
23
-
24
-
25
-
26
-
27
-
28
-
29
-
30
-
31
-
32
-
33
-
34
-
35
-
36
-
37
-
38
-
39
-
40
-
41
-
42
-
43
-
44
-
45
-
46
-
47
-
48
-
49
-
50
-
51
-
52
-
53
-
54
-
55
-
56
-
57
-
58
-
59
-
60
-
61
-
62
-
63
-
64
-
65
-
66
-
67
-
68
-
69
-
70
-
71
-
72
-
73
-
74
-
75
-
76
-
77
-
78
-
79
-
80
-
81
-
82
-
83
-
84
-
85
-
86
-
87
-
88
-
89
-
90
-
91
-
92
-
93
-
94
-
95
-
96
-
97
-
98
-
99
-
100
-
101
-
102
-
103
-
 104
104 -
 105
105 -
 106
106 -
 107
107 -
 108
108 -
 109
109 -
 110
110 -
 111
111 -
 112
112 -
 113
113 -
 114
114 -
 115
115 -
 116
116 -
 117
117 -
 118
118 -
 119
119 -
 120
120 -
 121
121 -
 122
122 -
 123
123 -
 124
124 -
125
-
126
-
127
-
128
-
129
-
130
-
131
-
132
-
133
-
134
-
135
-
136
-
137
-
138
-
139
-
140
-
141
-
142
-
143
-
144
-
145
-
146
-
147
-
148
-
149
-
150
-
151
-
152
-
153
-
154
-
155
-
156
-
157
-
158
-
159
-
160
-
161
-
162
-
163
-
164
-
165
-
166
-
167
-
168
-
169
-
170
-
171
-
172
-
173
-
174
-
175
-
176
-
177
-
178
-
179
-
180
-
181
-
182
-
183
-
184
-
185
-
186
-
187
-
188
-
189
-
190
-
191
-
192
-
193
-
194
-
195
-
196
-
197
-
198
-
199
-
200
 |
 |

F-6
Business Service Revenues
Business service revenues include revenues from integrated voice and data services, advanced data and traditional voice and
long-distance services to enterprise and small-business customers. Business service revenues also include revenue from other
carriers for special access circuits and fiber connections. We expect business service revenues to be favorably impacted by
increasing demand for data services such as integrated data and voice services, multi-site networking and data center services.
As wireless data usage grows and 4G networks are expanded, we expect to win additional opportunities to provide special
access services to support the capacity needs of wireless carriers.
We experience competition in the business channel primarily from other carriers, including traditional telephone companies and
competitive providers. Cable television companies are also a source of competition, primarily for small business customers and
wireless backhaul contracts.
Despite the opportunities for growth from business services, competition and weakness in the economy may have the effect of
suppressing short-term revenue growth. In addition, business voice and long-distance service revenues continue to decline due
to competition and migration to more advanced integrated voice and data services.
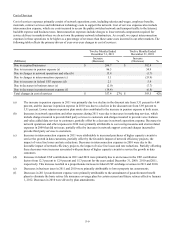
The following table reflects the primary drivers of year-over-year changes in business service revenues:
(Millions)
Due to acquired companies
Due to increases in data and integrated services revenues (a)
Due to increases in carrier revenues (b)
Due to increases in high-speed Internet revenues
Due to decreases in voice, long distance and miscellaneous
revenues (c)
Total changes in business revenues
Twelve Months Ended
December 31, 2011
Increase
(Decrease)
$ 467.9
54.3
38.6
0.2
(41.4)
$ 519.6
%
33%
Twelve Months Ended
December 31, 2010
Increase
(Decrease)
$ 610.2
7.6
15.2
6.0
(26.5)
$ 612.5
%
63%
(a) Increases in data and integrated services revenues were primarily due to demand for advanced data services and
customer migration to our integrated voice and data services, previously discussed.
(b) Increases in carrier revenues, which primarily represent monthly recurring charges for dedicated circuits, were
attributable to strong demand from wireless and other carriers, previously discussed.
(c) Decreases in voice service revenues were primarily attributable to competition and migration of existing customers to
integrated services.
Consumer Service Revenues
Consumer service revenues are generated from the provision of high-speed Internet, voice and video services to consumers.
We expect the trend of consumer voice line loss to continue as a result of competition from wireless carriers, cable television
companies and other providers using emerging technologies. For the twelve months ended December 31, 2011, consumer voice
lines decreased by approximately 81,000, or 4.0 percent. Increasing revenues from high-speed Internet and related services help
to offset some of the losses in consumer voice revenues. Demand for faster broadband speeds and Internet-related services,
such as virus protection or online data backup services, are expected to favorably impact consumer high-speed Internet
revenues, offsetting some of the decline in consumer voice revenues.
For the twelve months ended December 31, 2011, consumer high-speed Internet customers increased by approximately 49,000
or 4.2 percent. As of December 31, 2011, we provided high-speed Internet service to approximately 40 percent of total access
lines in service and approximately 67 percent of primary residential lines in service. As of December 31, 2011, approximately
75 percent of our total access lines had high-speed Internet competition, primarily from cable service providers. We do not
expect significant additional cable expansions into our service areas during 2012, but we could experience some increased
competition from high-speed Internet offerings of wireless competitors. We expect the pace of high-speed Internet customer
growth to slow as the number of households without high-speed Internet service shrinks.