Windstream 2011 Annual Report Download - page 165
Download and view the complete annual report
Please find page 165 of the 2011 Windstream annual report below. You can navigate through the pages in the report by either clicking on the pages listed below, or by using the keyword search tool below to find specific information within the annual report.-
 1
1 -
2
-
3
-
4
-
5
-
6
-
7
-
8
-
9
-
10
-
11
-
12
-
13
-
14
-
15
-
16
-
17
-
18
-
19
-
20
-
21
-
22
-
23
-
24
-
25
-
26
-
27
-
28
-
29
-
30
-
31
-
32
-
33
-
34
-
35
-
36
-
37
-
38
-
39
-
40
-
41
-
42
-
43
-
44
-
45
-
46
-
47
-
48
-
49
-
50
-
51
-
52
-
53
-
54
-
55
-
56
-
57
-
58
-
59
-
60
-
61
-
62
-
63
-
64
-
65
-
66
-
67
-
68
-
69
-
70
-
71
-
72
-
73
-
74
-
75
-
76
-
77
-
78
-
79
-
80
-
81
-
82
-
83
-
84
-
85
-
86
-
87
-
88
-
89
-
90
-
91
-
92
-
93
-
94
-
95
-
96
-
97
-
98
-
99
-
100
-
101
-
102
-
103
-
104
-
105
-
106
-
107
-
108
-
109
-
110
-
111
-
112
-
113
-
114
-
115
-
116
-
117
-
118
-
119
-
120
-
121
-
122
-
123
-
124
-
125
-
126
-
127
-
128
-
129
-
130
-
131
-
132
-
133
-
134
-
135
-
136
-
137
-
138
-
139
-
140
-
141
-
142
-
143
-
144
-
145
-
146
-
147
-
148
-
149
-
150
-
151
-
152
-
153
-
154
-
 155
155 -
 156
156 -
 157
157 -
 158
158 -
 159
159 -
 160
160 -
 161
161 -
 162
162 -
 163
163 -
 164
164 -
 165
165 -
 166
166 -
 167
167 -
 168
168 -
 169
169 -
 170
170 -
 171
171 -
 172
172 -
 173
173 -
 174
174 -
 175
175 -
176
-
177
-
178
-
179
-
180
-
181
-
182
-
183
-
184
-
185
-
186
-
187
-
188
-
189
-
190
-
191
-
192
-
193
-
194
-
195
-
196
-
197
-
198
-
199
-
200
 |
 |

NOTES TO CONSOLIDATED FINANCIAL STATEMENTS
____
F-57
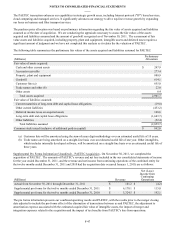
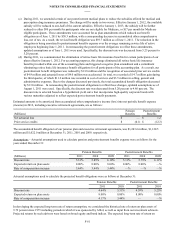
Interest Expense
Interest expense was as follows for the years ended December 31:
(Millions)
Interest expense related to long-term debt (a)
Impacts of interest rate swaps
Other interest expense
Less capitalized interest expense
Total interest expense
2011
$ 500.0
64.8
0.3
(6.8)
$ 558.3
2010
$ 466.1
57.2
0.5
(2.1)
$ 521.7
2009
$ 358.9
52.9
0.1
(1.7)
$ 410.2
(a) We recognized as interest expense in the accompanying consolidated income statements $1.8 million and $6.4 million
in arrangement and other fees related to the increase in the revolver capacity agreements and amendment and
restatement of our senior secured credit facility in 2010 and 2009, respectively.
In order to mitigate the interest rate risk inherent in our variable rate senior secured credit facility, we entered into four identical
pay fixed, receive variable interest rate swap agreements whose notional value totaled $1,018.7 million at December 31, 2011
(see Note 2).
6. Fair Value Measurements:
Fair value of financial and non-financial assets and liabilities is defined as an exit price, representing the amount that would be
received to sell an asset or transfer a liability in an orderly transaction between market participants. Authoritative guidance
defines the following three tier hierarchy for assessing the inputs used in fair value measurements:
Level 1 – Quoted prices in active markets for identical assets or liabilities
Level 2 – Observable inputs other than quoted prices in active markets for identical assets or liabilities
Level 3 – Unobservable inputs
The highest priority is given to unadjusted quoted prices in active markets for identical assets or liabilities (level 1
measurement) and the lowest priority is given to unobservable inputs (level 3 measurement). Assets and liabilities are classified
in their entirety based on the lowest level of input that is significant to the fair value measurement. Our assessment of the
significance of a particular input to the fair value measurement requires judgment and may affect the valuation of fair value
assets and liabilities and their placement within the fair value hierarchy levels.
Our non-financial assets and liabilities, including goodwill, intangible assets and asset retirement obligations, are measured at
fair value on a non-recurring basis. No event occurred during the year ended December 31, 2011 requiring these non-financial
assets and liabilities to be subsequently recognized at fair value.
Our financial instruments consist primarily of cash and cash equivalents, restricted cash, accounts receivable, income tax
receivable, accounts payable, long-term debt and interest rate swaps. The carrying amount of cash, restricted cash, accounts
receivable, income tax receivable and accounts payable was estimated by management to approximate fair value due to the
relatively short period of time to maturity for those instruments. Cash equivalents, long-term debt and interest rate swaps are
measured at fair value on a recurring basis.
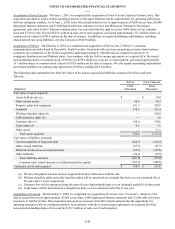
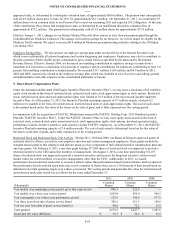
The fair values of our cash equivalents and interest rate swaps were determined using the following inputs at December 31:
(Millions)
Level 1 measurements:
Cash equivalents (a)
Level 2 measurements:
Interest rate swaps (b) (See Note 2)
2011
$ 153.1
$(119.2)
2010
$ 0.1
$(111.3)
(a) Recognized at fair value in cash and cash equivalents on the consolidated balance sheet as of December 31, 2011 and
2010.
(b) Recognized at fair value in current portion of interest rate swaps and other liabilities on the consolidated balance sheet
as of December 31, 2011 and 2010.
Our cash equivalents are primarily highly liquid, actively traded money market funds with next day access. The fair values of
the interest rate swaps were determined based on the present value of expected future cash flows using LIBOR swap rates