Windstream 2011 Annual Report Download - page 33
Download and view the complete annual report
Please find page 33 of the 2011 Windstream annual report below. You can navigate through the pages in the report by either clicking on the pages listed below, or by using the keyword search tool below to find specific information within the annual report.-
 1
1 -
2
-
3
-
4
-
5
-
6
-
7
-
8
-
9
-
10
-
11
-
12
-
13
-
14
-
15
-
16
-
17
-
18
-
19
-
20
-
21
-
22
-
 23
23 -
 24
24 -
 25
25 -
 26
26 -
 27
27 -
 28
28 -
 29
29 -
 30
30 -
 31
31 -
 32
32 -
 33
33 -
 34
34 -
 35
35 -
 36
36 -
 37
37 -
 38
38 -
 39
39 -
 40
40 -
 41
41 -
 42
42 -
 43
43 -
44
-
45
-
46
-
47
-
48
-
49
-
50
-
51
-
52
-
53
-
54
-
55
-
56
-
57
-
58
-
59
-
60
-
61
-
62
-
63
-
64
-
65
-
66
-
67
-
68
-
69
-
70
-
71
-
72
-
73
-
74
-
75
-
76
-
77
-
78
-
79
-
80
-
81
-
82
-
83
-
84
-
85
-
86
-
87
-
88
-
89
-
90
-
91
-
92
-
93
-
94
-
95
-
96
-
97
-
98
-
99
-
100
-
101
-
102
-
103
-
104
-
105
-
106
-
107
-
108
-
109
-
110
-
111
-
112
-
113
-
114
-
115
-
116
-
117
-
118
-
119
-
120
-
121
-
122
-
123
-
124
-
125
-
126
-
127
-
128
-
129
-
130
-
131
-
132
-
133
-
134
-
135
-
136
-
137
-
138
-
139
-
140
-
141
-
142
-
143
-
144
-
145
-
146
-
147
-
148
-
149
-
150
-
151
-
152
-
153
-
154
-
155
-
156
-
157
-
158
-
159
-
160
-
161
-
162
-
163
-
164
-
165
-
166
-
167
-
168
-
169
-
170
-
171
-
172
-
173
-
174
-
175
-
176
-
177
-
178
-
179
-
180
-
181
-
182
-
183
-
184
-
185
-
186
-
187
-
188
-
189
-
190
-
191
-
192
-
193
-
194
-
195
-
196
-
197
-
198
-
199
-
200
 |
 |

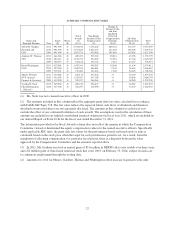
SUMMARY COMPENSATION TABLE
Name and
Principal Position Year
Salary
($)
Bonus
($)
Stock
Awards
($)
(2) (3)
Non-Equity
Incentive Plan
Compensation
($)
Change in
Pension Value
and Non-
Qualified
Deferred
Compensation
Earnings
($) (4)
All Other
Compensation
($) (5)
Total
($)
Jeffery R. Gardner
President and
CEO
2011
2010
2009
991,000
991,000
991,000
-0-
-0-
-0-
6,536,104
3,517,827
3,407,571
1,738,246
2,242,347
920,002
389,362
472,454
395,899
132,747
106,108
112,918
9,787,459
7,329,736
5,827,390
Anthony W. Thomas
CFO
2011
2010
2009
466,788
404,712
308,077
-0-
-0-
-0-
689,453
1,158,753
212,124
533,226
524,587
155,152
20,016
13,991
7,614
43,296
27,146
22,107
1,752,779
2,129,189
705,074
Brent Whittington
COO
2011
2010
2009
612,981
593,269
519,231
-0-
-0-
-0-
1,078,301
1,640,334
770,406
690,387
868,881
357,418
10,508
7,344
7,180
81,834
76,654
54,265
2,474,011
3,186,482
1,708,500
John P. Fletcher
EVP, General
Counsel & Secretary
2011
2010
2009
470,288
436,298
412,500
-0-
-0-
-0-
816,113
1,376,457
520,357
533,226
637,180
268,063
-0-
-0-
-0-
54,129
30,808
38,280
1,873,756
2,480,743
1,239,200
Cynthia B. Nash
Chief Information
Officer(1)
2011
2010
345,962
317,308
-0-
-0-
400,210
788,297
294,677
318,590
-0-
-0-
26,987
16,363
1,067,835
1,440,558
(1) Ms. Nash was not a named executive officer in 2009.
(2) The amounts included in this column reflect the aggregate grant date fair value calculated in accordance
with FASB ASCTopic 718. The fair value reflects the expected future cash flows of dividends and therefore
dividends on unvested shares are not separately disclosed. The amounts in this column for each fiscal year
exclude the effect of any estimated forfeitures of such awards. The assumptions used in the calculation of these
amounts are included in our audited consolidated financial statements for fiscal year 2011, which are included in
our Annual Report on Form 10-K for the fiscal year ended December 31, 2011.
The information provided in the Stock Awards column does not reflect the manner in which the Compensation
Committee viewed or determined the equity compensation values for the named executive officers. Specifically,
under applicable SEC rules, the grant date fair values for the performance-based restricted stock or units is
calculated based on the stock price when the target for each performance period is set. As a result, from the
standpoint of allocating compensation to a particular fiscal period, there is a disparity between the value
approved by the Compensation Committee and the amounts reported above.
(3) In 2011, Mr. Gardner received an annual grant of $3.6 million in PBRSUs that vests ratably over three years
and a $2 million grant of time-based restricted stock that vests 100% on February 15, 2014, subject in each case
to continuous employment through the vesting date.
(4) Amounts for 2011 for Messrs. Gardner, Thomas and Whittington reflect increase in pension value only.
27