Windstream 2011 Annual Report Download - page 187
Download and view the complete annual report
Please find page 187 of the 2011 Windstream annual report below. You can navigate through the pages in the report by either clicking on the pages listed below, or by using the keyword search tool below to find specific information within the annual report.-
 1
1 -
2
-
3
-
4
-
5
-
6
-
7
-
8
-
9
-
10
-
11
-
12
-
13
-
14
-
15
-
16
-
17
-
18
-
19
-
20
-
21
-
22
-
23
-
24
-
25
-
26
-
27
-
28
-
29
-
30
-
31
-
32
-
33
-
34
-
35
-
36
-
37
-
38
-
39
-
40
-
41
-
42
-
43
-
44
-
45
-
46
-
47
-
48
-
49
-
50
-
51
-
52
-
53
-
54
-
55
-
56
-
57
-
58
-
59
-
60
-
61
-
62
-
63
-
64
-
65
-
66
-
67
-
68
-
69
-
70
-
71
-
72
-
73
-
74
-
75
-
76
-
77
-
78
-
79
-
80
-
81
-
82
-
83
-
84
-
85
-
86
-
87
-
88
-
89
-
90
-
91
-
92
-
93
-
94
-
95
-
96
-
97
-
98
-
99
-
100
-
101
-
102
-
103
-
104
-
105
-
106
-
107
-
108
-
109
-
110
-
111
-
112
-
113
-
114
-
115
-
116
-
117
-
118
-
119
-
120
-
121
-
122
-
123
-
124
-
125
-
126
-
127
-
128
-
129
-
130
-
131
-
132
-
133
-
134
-
135
-
136
-
137
-
138
-
139
-
140
-
141
-
142
-
143
-
144
-
145
-
146
-
147
-
148
-
149
-
150
-
151
-
152
-
153
-
154
-
155
-
156
-
157
-
158
-
159
-
160
-
161
-
162
-
163
-
164
-
165
-
166
-
167
-
168
-
169
-
170
-
171
-
172
-
173
-
174
-
175
-
176
-
 177
177 -
 178
178 -
 179
179 -
 180
180 -
 181
181 -
 182
182 -
 183
183 -
 184
184 -
 185
185 -
 186
186 -
 187
187 -
 188
188 -
 189
189 -
 190
190 -
 191
191 -
 192
192 -
 193
193 -
 194
194 -
 195
195 -
 196
196 -
 197
197 -
198
-
199
-
200
 |
 |

NOTES TO CONSOLIDATED FINANCIAL STATEMENTS
____
F-79
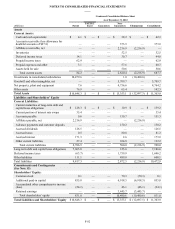
Debentures and notes, issued by PAETEC Holding Corporation
In connection with the acquisition of PAETEC on November 30, 2011, Windstream Corporation (the “Parent”) acquired the
PAETEC 2015 Notes, the PAETEC 2017 Notes and the PAETEC 2018 Notes (“the guaranteed notes”). Windstream
Corporation and all former wholly-owned subsidiaries of PAETEC (the “Guarantors”) provide guarantees of those debentures.
These guarantees are full and unconditional, subject to certain customary release provisions, as well as joint and several.
Certain Guarantors may be subject to restrictions on their ability to distribute earnings to the Parent. The remaining subsidiaries
(the “Non-Guarantors”) of the Parent are not guarantors of these guaranteed notes.
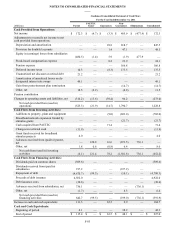
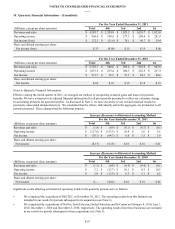
The following information presents condensed consolidated and combined statements of income for the years ended
December 31, 2011, 2010 and 2009, condensed consolidated balance sheets as of December 31, 2011 and 2010, and condensed
consolidated and combined statements of cash flows for the years ended December 31, 2011, 2010 and 2009 of the Parent, the
Guarantors and the Non-Guarantors. Investments consist of investments in net assets of subsidiaries held by the Parent and
other subsidiaries, and have been presented using the equity method of accounting.
(Millions)
Revenues and sales:
Service revenues
Product sales
Total revenues and sales
Costs and expenses:
Cost of services
Cost of products sold
Selling, general, administrative and other
Depreciation and amortization
Merger, integration and restructuring costs
Total costs and expenses
Operating income
Earnings (losses) from consolidated
subsidiaries
Other income (expense), net
Loss on early extinguishment of debt
Intercompany interest income (expense)
Interest expense
Income (loss) before income taxes
Income taxes (benefit)
Income (loss) from continuing operations
Discontinued operations, net of tax
Net income
Condensed Consolidated Statement of Income
For the Year Ended December 31, 2011
Parent
$—
—
—
—
—
—
—
—
—
—
480.5
(3.8)
(136.1)
167.2
(547.3)
(39.5)
(211.8)
172.3
—
$ 172.3
PAETEC
Issuer
$—
—
—
—
—
—
—
—
—
—
1.4
—
—
(2.0)
(8.6)
(9.2)
(4.5)
(4.7)
—
$(4.7)
Guarantors
$ 165.8
16.2
182.0
91.7
13.0
41.9
28.8
3.9
179.3
2.7
(5.9)
—
—
2.0
(0.1)
(1.3)
1.9
(3.2)
(0.1)
$(3.3)
Non-
Guarantors
$ 3,991.9
113.0
4,104.9
1,594.6
92.3
566.8
818.7
67.2
3,139.6
965.3
1.9
3.7
—
(167.2)
(2.3)
801.4
315.5
485.9
—
$ 485.9
Eliminations
$(1.2)
—
(1.2)
(1.2)
—
—
—
—
(1.2)
—
(477.9)
—
—
—
—
(477.9)
—
(477.9)
—
$(477.9)
Consolidated
$ 4,156.5
129.2
4,285.7
1,685.1
105.3
608.7
847.5
71.1
3,317.7
968.0
—
(0.1)
(136.1)
—
(558.3)
273.5
101.1
172.4
(0.1)
$ 172.3