Windstream 2011 Annual Report Download - page 126
Download and view the complete annual report
Please find page 126 of the 2011 Windstream annual report below. You can navigate through the pages in the report by either clicking on the pages listed below, or by using the keyword search tool below to find specific information within the annual report.-
 1
1 -
2
-
3
-
4
-
5
-
6
-
7
-
8
-
9
-
10
-
11
-
12
-
13
-
14
-
15
-
16
-
17
-
18
-
19
-
20
-
21
-
22
-
23
-
24
-
25
-
26
-
27
-
28
-
29
-
30
-
31
-
32
-
33
-
34
-
35
-
36
-
37
-
38
-
39
-
40
-
41
-
42
-
43
-
44
-
45
-
46
-
47
-
48
-
49
-
50
-
51
-
52
-
53
-
54
-
55
-
56
-
57
-
58
-
59
-
60
-
61
-
62
-
63
-
64
-
65
-
66
-
67
-
68
-
69
-
70
-
71
-
72
-
73
-
74
-
75
-
76
-
77
-
78
-
79
-
80
-
81
-
82
-
83
-
84
-
85
-
86
-
87
-
88
-
89
-
90
-
91
-
92
-
93
-
94
-
95
-
96
-
97
-
98
-
99
-
100
-
101
-
102
-
103
-
104
-
105
-
106
-
107
-
108
-
109
-
110
-
111
-
112
-
113
-
114
-
115
-
 116
116 -
 117
117 -
 118
118 -
 119
119 -
 120
120 -
 121
121 -
 122
122 -
 123
123 -
 124
124 -
 125
125 -
 126
126 -
 127
127 -
 128
128 -
 129
129 -
 130
130 -
 131
131 -
 132
132 -
 133
133 -
 134
134 -
 135
135 -
 136
136 -
137
-
138
-
139
-
140
-
141
-
142
-
143
-
144
-
145
-
146
-
147
-
148
-
149
-
150
-
151
-
152
-
153
-
154
-
155
-
156
-
157
-
158
-
159
-
160
-
161
-
162
-
163
-
164
-
165
-
166
-
167
-
168
-
169
-
170
-
171
-
172
-
173
-
174
-
175
-
176
-
177
-
178
-
179
-
180
-
181
-
182
-
183
-
184
-
185
-
186
-
187
-
188
-
189
-
190
-
191
-
192
-
193
-
194
-
195
-
196
-
197
-
198
-
199
-
200
 |
 |

F-18
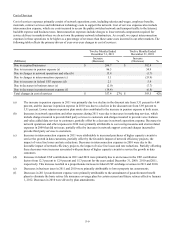
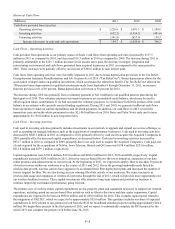
Historical Cash Flows
(Millions)
Cash flows provided from (used in):
Operating activities
Investing activities
Financing activities
Increase (decrease) in cash and cash equivalents
2011
$ 1,228.8
(652.2)
(391.9)
$ 184.7
2010
$ 1,091.3
(1,454.3)
(657.6)
$(1,020.6)
2009
$ 1,109.6
(481.6)
138.3
$ 766.3
Cash Flows – Operating Activities
Cash provided from operations is our primary source of funds. Cash flows from operating activities increased by $137.5
million in 2011 as compared to 2010, and decreased $18.3 million in 2010 as compared to 2009. The increase during 2011 is
primarily attributable to the $131.7 million decrease in net income taxes paid, the decrease in merger, integration and
restructuring costs incurred and cash flows generated from acquired businesses in 2011 as compared to the same period in
2010. These increases were partially offset by an increase of $108.6 million in cash interest paid.
Cash flows from operating activities were favorably impacted in 2011 due to bonus depreciation provisions in the Tax Relief,
Unemployment Insurance Reauthorization, and Job Creation Act of 2010 ("Tax Relief Act"). Bonus depreciation allows for the
acceleration of depreciation on qualified investments, which accelerates the related tax benefit. The Tax Relief Act allowed for
100 percent bonus depreciation for qualified investments made from September 8 through December 31, 2011, an increase
from the previous level of 50 percent. Bonus depreciation will return to 50 percent for 2012.
The decrease during 2010 was primarily from a voluntary payment of $41.0 million to our qualified pension plan during the
third quarter of 2010. This voluntary payment was made to preserve an accumulated credit balance, which may be used to
offset required future contributions. If we had not made the voluntary payment, we would have forfeited a portion of the credit
balance in accordance with currently enacted funding regulations. During 2011 and 2010, we generated sufficient cash flows
from operations to fund our capital expenditures and dividend payments. In addition, our cash flows in 2011 covered the
transaction costs and make-whole premiums to retire $2,146.0 million of our 2016 Notes and Valor Notes early and to issue
approximately $1,750.0 million in new long-term notes.
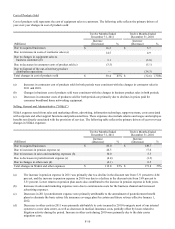
Cash Flows – Investing Activities
Cash used in investing activities primarily includes investments in our network to upgrade and expand our service offerings, as
well as spending on strategic initiatives such as the acquisition of complementary businesses. Cash used in investing activities
decreased by $802.1 million in 2011 as compared to 2010, primarily driven by cash used to acquire the Acquired Companies in
2010, partially offset by increased capital expenditures, as discussed below. Cash used in investing activities increased by
$972.7 million in 2010 as compared to 2009, primarily due to net cash used to acquire the Acquired Companies. Cash paid, net
of cash acquired for the acquisitions of NuVox, Iowa Telecom, Hosted and Q-Comm was $198.4 million, $253.6 million,
$312.8 million and $279.1 million, respectively.
Capital expenditures were $702.0 million, $412.0 million and $286.9 million for 2011, 2010 and 2009, respectively. Capital
expenditures increased $290.0 million in 2011, driven by success-based fiber-to-the-tower initiatives, expansion of our data
center presence and enhancements to our network. At the beginning of 2011, we expected to deploy fiber to less than 50 percent
of wireless towers within our territories over the course of 2011 and 2012. Given the growing bandwidth needs fueled by
wireless data growth, wireless carriers have aggressively accelerated their fiber deployment plans and increased the number of
towers targeted for fiber. We are also having success winning fiber bids outside of our territories. We expect increases in
wireless data usage and expansion of wireless 4G networks through the end of 2013, which will provide more opportunities for
our wireless backhaul services. These capital investments offer attractive long-term returns and position our business to
continue improving our financial performance going forward.
The primary uses of cash for future capital expenditures are for property, plant and equipment necessary to support our network
operations, including spend on success-based fiber initiatives such as fiber-to-the-tower and data center expansions. Capital
expenditures are expected to be between $950.0 million and $1,050.0 million for 2012. This excludes capital spend related to
the integration of PAETEC, which we expect to be approximately $55.0 million. This guidance includes our share of expected
expenditures in 2012 related to our grants received from the RUS for broadband stimulus projects totaling approximately $44.0
million. We began these projects in the first quarter of 2011, and we expect to substantially complete the RUS projects by the
end of 2013 and complete the projects well before June 30, 2015.