Windstream 2011 Annual Report Download - page 120
Download and view the complete annual report
Please find page 120 of the 2011 Windstream annual report below. You can navigate through the pages in the report by either clicking on the pages listed below, or by using the keyword search tool below to find specific information within the annual report.-
 1
1 -
2
-
3
-
4
-
5
-
6
-
7
-
8
-
9
-
10
-
11
-
12
-
13
-
14
-
15
-
16
-
17
-
18
-
19
-
20
-
21
-
22
-
23
-
24
-
25
-
26
-
27
-
28
-
29
-
30
-
31
-
32
-
33
-
34
-
35
-
36
-
37
-
38
-
39
-
40
-
41
-
42
-
43
-
44
-
45
-
46
-
47
-
48
-
49
-
50
-
51
-
52
-
53
-
54
-
55
-
56
-
57
-
58
-
59
-
60
-
61
-
62
-
63
-
64
-
65
-
66
-
67
-
68
-
69
-
70
-
71
-
72
-
73
-
74
-
75
-
76
-
77
-
78
-
79
-
80
-
81
-
82
-
83
-
84
-
85
-
86
-
87
-
88
-
89
-
90
-
91
-
92
-
93
-
94
-
95
-
96
-
97
-
98
-
99
-
100
-
101
-
102
-
103
-
104
-
105
-
106
-
107
-
108
-
109
-
 110
110 -
 111
111 -
 112
112 -
 113
113 -
 114
114 -
 115
115 -
 116
116 -
 117
117 -
 118
118 -
 119
119 -
 120
120 -
 121
121 -
 122
122 -
 123
123 -
 124
124 -
 125
125 -
 126
126 -
 127
127 -
 128
128 -
 129
129 -
 130
130 -
131
-
132
-
133
-
134
-
135
-
136
-
137
-
138
-
139
-
140
-
141
-
142
-
143
-
144
-
145
-
146
-
147
-
148
-
149
-
150
-
151
-
152
-
153
-
154
-
155
-
156
-
157
-
158
-
159
-
160
-
161
-
162
-
163
-
164
-
165
-
166
-
167
-
168
-
169
-
170
-
171
-
172
-
173
-
174
-
175
-
176
-
177
-
178
-
179
-
180
-
181
-
182
-
183
-
184
-
185
-
186
-
187
-
188
-
189
-
190
-
191
-
192
-
193
-
194
-
195
-
196
-
197
-
198
-
199
-
200
 |
 |

F-12
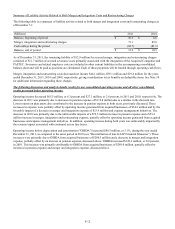
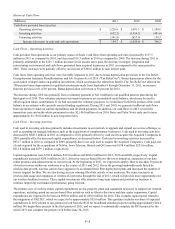
Summary of Liability Activity Related to Both Merger and Integration Costs and Restructuring Charges
The following table is a summary of liability activity related to both merger and integration costs and restructuring charges as
of December 31:
(Millions)
Balance, beginning of period
Merger, integration and restructuring charges
Cash outlays during the period
Balance, end of period
2011
$ 10.5
71.1
(68.7)
$ 12.9
2010
$ 6.6
85.0
(81.1)
$ 10.5
As of December 31, 2011, the remaining liability of $12.9 million for accrued merger, integration and restructuring charges
consisted of $11.7 million of accrued severance costs primarily associated with the integration of the Acquired Companies and
PAETEC. Severance and related employee costs are included in other current liabilities in the accompanying consolidated
balance sheet and will be paid as positions are eliminated. Each of these payments will be funded through operating cash flows.
Merger, integration and restructuring costs decreased net income $44.1 million, $59.1 million and $19.4 million for the years
ended December 31, 2011, 2010 and 2009, respectively, giving consideration to tax benefits on deductible items. See Note 10
for additional information regarding these charges.
The following discussion and analysis details results for our consolidated operating income and all other consolidated
results presented below operating income.
Operating income decreased $65.5 million, or 6.3 percent and $27.1 million, or 2.6 percent, in 2011 and 2010, respectively. The
decrease in 2011 was primarily due to increases in pension expense of $112.8 million due to a decline in the discount rate.
Lower returns on plan assets also contributed to the increase in pension expense in both years, previously discussed. These
increases in expense were partially offset by operating income generated from acquired businesses of $54.2 million and by the
favorable impact of a decrease in merger and integration expense of $13.9 million and expense management initiatives. The
decrease in 2010 was primarily due to the unfavorable impacts of a $72.5 million increase in pension expense and a $53.4
million increase in merger, integration and restructuring expense, partially offset by operating income generated from acquired
businesses and expense management initiatives. In addition, operating income during both years was unfavorably impacted by
the revenue impact associated with continued access line losses.
Operating income before depreciation and amortization ("OIBDA") increased $88.3 million, or 5.1%, during the year ended
December 31, 2011, as compared to the same period in 2010 (see "Reconciliation of non-GAAP Financial Measures"). These
increases were primarily due to OIBDA from acquired businesses of $200.3 million and a decrease in merger and integration
expense, partially offset by an increase in pension expense, discussed above. OIBDA increased $128.3 million, or 8.0 percent,
in 2010. This increase was primarily attributable to OIBDA from acquired businesses of $249.0 million, partially offset by
increases in pension expense and merger and integration expense, discussed above.